Statistical Process Control – A Manufacturer’s Guide
Statistical Process Control can be an invaluable method for preemptively discovering and finding solutions for production issues, ensuring product conformance, enhancing productivity, and reducing waste.

You can also listen to this article:
What is Statistical Process Control?
Statistical Process Control (SPC) is a data-driven industry-standard process that uses statistical methods for monitoring quality and discovering inconsistencies in manufacturing processes. The goal of SPC is to determine a process’s conformance with customer requirements, ensure its stability, and identify any inconsistencies often before the process completes or even starts.
A key distinction between many quality assurance methods and SPC is that while the former are often detection-based or determine items’ conformity in the inspection phase, SPC attempts to predict any issues before they arise, making it a preventative method. SPC thus has a great potential for reducing waste, controlling costs, and increasing overall manufacturing efficiency.
Manufacturing companies are increasingly turning to ERP and MRP systems to help drive efficiency and control over their processes. But even with a best-in-class MRP system, manufacturing companies need a philosophy and a systemized way of measuring production to ensure its quality. SPC represents a transition away from independent post-production inspection processes toward preventative and continuous monitoring within manufacturing. It utilizes various tools such as run charts, control charts, design of experiments, and continuous improvement initiatives.
History of Statistical Process Control
Statistical Process Control has been around for a little over a century. First developed by Walter Shewhart from Bell Laboratories, the initial concept and use of control charts was put to work developing a statistical basis for the sampling of materials produced for munitions in the early 1930s.
With the help of W. Edwards Deming’s development of quality training courses used in US industry in WWII and afterward during the occupation, SPC was later introduced to Japan as well.
Key to the building of SPC, Shewhart early on identified two types of process variation. The first was chance variation, defined as a variation that is inherent in a process. Chance variation is stable over time and can therefore be measured and accounted for. Within SPC terminology, the chance cause became known as Common Cause Variation.
The second type of variation is uncontrolled variation. Uncontrolled variation is attributed to events that occur outside the production system. This type of variation became known as Special Cause Variation within SPC.
As Shewhart identified these types of variation, he then developed control charts that allowed manufacturers to plot data over a time curve and to discern both Common Cause and Special Cause variation. These charts and tools remain part of the core of SPC today and as the methodology has developed, other tools have been added as well.
How Statistical Process Control Works
All processes exhibit variation. However, Shewhart discovered early that unlike natural phenomena, variation in manufacturing processes had a different behavior pattern than that of natural occurrences. It was here that the distinction between common and special causes of variation was developed.
Common Cause variation consists of random causes and naturally occurring problems related to the process. It could be that one employee takes longer to perform a task than another. Or it could be variations that occur based on ambient temperature changes within the facility from cooler evening shifts to warmer day shifts. A final example could be the measurable wearing of parts on a machine where adjustments can be made over time to keep the process in control as parts wear.
Read more about Maintenance Management.
Other causes may include measurement errors, lack of defined procedures, and others. If the common cause variation is predictable, historically understood, and does not impact overly high or low values, then the variation is likely to be within 3 standard deviations from the mean and is considered “In Control” or statistically stable.
Special Cause variation consists of occurrences that have not historically been part of the measured and observed process. They are also unpredictable and often cause a disruption that pushes data outside the predictable control chart for that measured period.
One example could be an intermittent power outage that stops and starts production over a period. Another example would be a computer crash or a cybersecurity issue where computers that control equipment are hacked.

The differentiation of common and special cause variation allows manufacturing managers to enact appropriate responses depending on the type of variation.
Common cause variations can be adjusted or addressed without throwing the entire process out of variation, such as when mechanics adjust naturally wearing parts to keep product within acceptable ranges or when managers implement additional training the help employees improve time on task.
Special cause variations may require more aggressive or remedial action or outside resources to address to return the production system to a state where it is in control.
SPC uses a standard set of statistical and analytical tools to control process inputs. These process inputs are independent variables that are entered into the specific tools to provide insight and analysis to determine whether the process is in control and what steps need to be taken to maintain control.
Also read about the Cost of Quality and How to Calculate It.
Statistical Process Control Tools
As Statistical Process Control developed over the last century, a standard set of statistical and analytical tools were used. The first seven are referred to as “QC”, or “7-QC” tools, for quality control. As the discipline and methodology developed, 7 additional “supplemental tools (7-SUPP) were developed to improve the process. The seven quality control tools (7-QC) are:
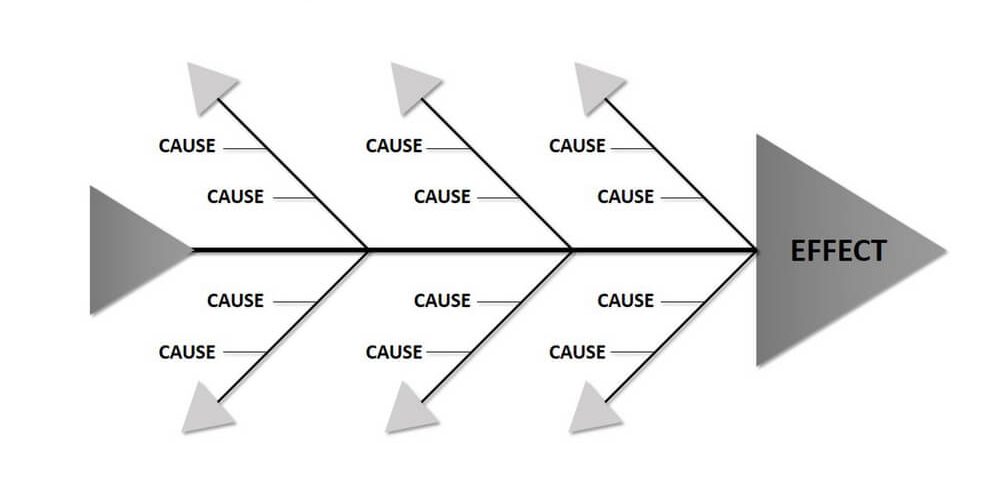
- Cause and Effect Diagram: The Cause-and-Effect Diagram is also referred to as a Fishbone Diagram. This is a cause analysis method that allows for the identification of many different causes that may have been responsible for the variation. This tool is used when causes of the variation are unknown or are perhaps related to other causes. It is quite common to use the “5 Why’s” process when using the cause and effect to determine the root cause of the variation.
- Check Sheet – A check sheet is a basic data collection tool that allows analysis from the collected data. If data can be observed and collected by a staff member in the same place and the same frequency, a check sheet can be a source for data to determine problems and variations.
- Control Chart – Control charts are used to map process changes over time. Each control chart has an upper and lower control limit as well as an average line. By observing real-time data, a comparison can be made over time to determine whether the process is in control or out of control. Control charts are great for identifying variations as they occur or to determine whether a process is stable. They can also be used on special cause variation and to help determine what action needs to be taken.
- Histogram – Histograms represent data as graphical plots of data groups using user-defined ranges. In many ways, it is like a bar graph. A histogram groups data into ranges where they can be interpreted by the user. They help understand the number of times a specific variable occurs within a specified range.
- Pareto Chart – Everyone has at times seen a Pareto chart. Pareto charts are used to delineate value or time as a bar graph from most to least. This gives the user a graphical representation of the use of time, cost, or frequency expended for a particular asset or variable. Pareto charts are useful when determining frequency, when analyzing cost by component or when determining the most significant cause to begin action.
- Scatter Diagram – A scatter diagram is used when analyzing two variables to determine their relationship and to determine how closely related they are. If the plotted points are scattered about the diagram, the less they are perceived to be correlated. If they are close to the line, the closer the correlation. Scatter charts are used in situations where data can be paired such as determining if two effects have resulted from the same cause.
- Stratification – Simply put, stratification is used to group and sort data into categories. As raw data must be categorized to be useful, stratification is best used before data collection to know where to assign the individual data points for later analysis. This may include shifts, weeks, vendors, or product types.
The seven supplemental tools (7-SUPP) include:
- Data Stratification – Like stratification, data stratification groups data into categories. By breaking data into categories such as shift, machine, department, material, supplier, and other variables, patterns can be determined to help define and control variation.
- Defect Maps – Defect maps are a way to visualize the item evaluated for quality. The visualization allows for quick analysis by a Six Sigma team or other process improvement team for corrective action. In a defect map, operators or technicians may mark the place they found a defect on a specification drawing. This visual representation of the defect location and rate allows the team in charge of improvement to look at upstream causes for correction.
- Event Logs – As automation through IIoT and even ERP and MRP automation has resulted in easily accessible machine level real-time data, event logs have become more important. Event logs are collections of data with written descriptions of events surrounding a variable that has introduced a variation. It allows users to see what was experienced by the production line staff or the computer at the point the variation occurred.
- Process Flowcharts – It is impossible to improve a process without an understanding of the linear progression of that process. A process flowchart is a non-statistical tool that maps the steps in the process. By fully defining the process steps, other SPC tools can be used for the entire process flow or for steps within the flowchart. It helps understand what needs to be measured and it helps create consensus on what steps are in the process so that other SPC tools can be applied.
- Progress Centers – Progress centers are the tools used to centralize and track the progress to help guide decision making. By collecting project progress data and mapping it, users can determine the likelihood of completion on schedule and enact remedial steps to bring the project back on track if it is varying from the expected timeline.
- Randomization – Randomization is an attempt to make a variation occur by chance. It is an experiment to eliminate bias and create conditions for a variation to occur naturally to allow analysts to find the root cause. The elimination of bias means that users can identify variation before it occurs and adjust accordingly.
- Sample Size Determination – There is an old saying that says that you can’t measure what you can’t count. But it is also relevant to have a statistically acceptable number of things to count as well. Sample size determination is used to help set the number of elements, items, people, shifts or other counting units to be used in a representative group for counting.
Variations in Manufacturing
Because no two products will ever be precisely the same, best practice manufacturing processes seek to control variation to ensure that production creates the closest facsimile possible. By reducing the variation to where it is statistically insignificant, repeatability is ensured, and products cannot be perceived by consumers as different from one another.
Here are some practical examples of variation that can be controlled in manufacturing:
- Wear and Tear – Shafts, belts, pulleys, gears, and other components wear down over time. This does not mean that the components have reached the end of their lifecycle. The degree of wear and tear can be measured, and the effects analyzed so that adjustments can be made to optimize their lifecycle and deliver the value of the part while still producing high-quality goods. These adjustments can be measured and plotted using SPC to determine when to adjust based on time and product variables that create the wear.
- Conditions – Most manufacturing operations run on a 24-hour schedule with continuous operation. Depending on the geography, it is not unusual to have large swings in temperature, humidity, and barometric pressure from night to day and from day to evening shift. SPC can determine the amount and the degree of adjustment required depending on the range as well as season.
- Seasonality – Many manufacturing companies operate a stable workforce throughout the year. However, others have fully seasonal elements to their operation or at least some degree of seasonality. For those whose operation adds staff at different times of the year to augment the regular workforce, variation because of training can occur. SPC allows managers to factor this into the time, units produced and other key performance indicators to adjust for variation.
- Lot to Lot Differentiation – In many industries, lots are different from vendor to vendor, season to season, or batch to batch. An example would be commodified producers who rely on seasonally produced raw materials such as cotton. Slight differences in fiber length, density, and other factors may result in variations at towel or sheeting manufacturers where SPC analysis can help mitigate these effects to allow for continued performance to specifications. The same may be true for food processors struggling with sugar content, or mineral raw materials with varying levels of impurity.
Statistical Process Control in Manufacturing
Applying SPC in manufacturing requires several basic steps. First, manufacturers must understand their process, workflow, workstations, and specification requirements for their products. In larger companies, these elements may have been measured during the design stage by industrial engineers. However, in small to medium-sized companies, it is critical to fully document and measure these processes, especially as a company scales, so that variations do not move wildly out of control.
Secondly, an effort should be made to eliminate the special causes of variation so that only common causes remain. This allows managers and planners to develop process improvements that focus on the common and controllable aspects of production. By minimizing the upper and lower limits, many variations can be rendered statistically irrelevant as the process improves.
Finally, companies can use the tools and charts that have been the mainstay for SPC for many decades to provide continuous monitoring of the process. The process of monitoring can be aided by automation tools such as IIoT technology and even the native functionality of MRP and ERP software.
By using all the tools available through SPC, the goal is to continuously improve a process that does not exhibit variation above or below the upper and lower limits. In doing so, the process is considered “stable”.

Benefits of Using Statistical Process Control
When properly applied, Statistical Process Control can help hone your manufacturing process to eliminate variation. Some of the benefits of using SPC include:
- Reduced Waste – By reducing variation, scrap and rework are reduced or eliminated. This has a direct cost benefit as well as that of freeing up capacity.
- Productivity – Because ongoing process improvement derived from SPC is more efficient, productivity is improved.
- Continuous Improvement – Because the process is continuously monitored, control can be maintained for all processes. This allows near real-time analysis to identify problems as or before they occur and adjust.
- Easier Decision-Making – Because SPC analyzes data and uses statistical analysis to bear out results, decision-making is easier, and the impact of the decisions is greater.
- Evaluate Process Capability – All companies want to scale. And as a company’s product offering grows, there is a tendency to overreach with existing equipment capability. SPC can help match process capability with actual product specifications. This allows decision-makers to understand when they should add equipment or machinery or upgrade existing capacity to reduce variations in new product offerings.
Because all processes have variations, SPC can be used to predict and improve to bring that variation into an acceptable or statistically irrelevant range. By charting a course using SPC, a manufacturing company can determine the guiding principles for its quality to match the capabilities of its ERP or MRP software or even use them in conjunction with such software to multiply the value of SPC.
Conclusion
Statistical Process Control is a method for improving quality in the workplace. It uses statistical tools in order to find and track inconsistencies in the production process, and identify the causes of product non-conformity.
The approach distinguishes two types of variations: Common Cause and Special Cause. In general, Common Cause variations are predictable and can be remedied with, for example, equipment maintenance or workforce training. Special Cause variations are unpredictable and often require outside help, for example, in the case of a server outage.
SPC uses a plethora of tools that are divided into the seven quality control tools (7-QC) and the seven supplemental tools (7-SUPP). These consist of diagrams, graphs, categorization techniques, etc.
When properly implemented, Statistical Process Control can noticeably improve manufacturing processes, help minimize waste, and contribute to greater productivity and continuous improvement.
You may also like Materials Management – Best Practices for Small Manufacturers.