What Is Safety Stock and How to Calculate It?
Safety stock is the buffer inventory that helps companies keep serving their customers when disruptions occur. Striking a balance between stockouts and overstocking needs to rely on reliable data and mathematical equations, however.

You can also listen to this article:
What is safety stock?
Safety stock is the extra inventory kept to reduce the risk of stock-outs caused by inconsistencies in supply and demand.
Factors like lead time variability, customer demand fluctuations, and supply chain disruptions are common reasons why businesses maintain safety stock. By holding safety stock, a company ensures continuous production and high customer service levels, avoiding potential losses.
Holding safety stock is a balancing act. Too much buffer stock can lead to increased holding costs and potential obsolescence, while too little increases the risk of stockouts. Effective inventory management and forecasting are key to determining the optimal safety stock levels.
Why is safety stock important?
Safety stock plays an important role in efficient inventory management, both when dealing with raw materials and finished goods. Here is how keeping a buffer helps:
- Shortage prevention. The primary function of safety stock is to act as a protective buffer against unexpected surges in demand or delays in supply. This helps prevent stockouts, ensuring that you always have enough stock to deliver to customers.
- Greater customer satisfaction. By preventing shortages, safety stock contributes to reliable order fulfillment. This reliability improves customer satisfaction and trust, which is vital for repeat business and developing a good reputation.
- Uninterrupted production process. For manufacturers, an extra stock of raw materials ensures that production can continue smoothly without interruptions due to supply chain issues. This consistency is key for meeting production targets and deadlines.
- Supply chain variability mitigation. Buffer stock acts as a hedge against uncertainties in the supply chain, such as supplier delays, transportation issues, or quality problems. It gives companies time to respond to and manage these issues without impacting their operations.
- Supports sales and marketing efforts. Having safety stock allows businesses to confidently organize sales campaigns, knowing they can meet the increased demand generated by these activities.
In summary, safety stock is a vital component of inventory management that helps businesses maintain operational continuity, meet demand, improve customer satisfaction, and increase overall resilience against supply chain uncertainties.
Safety stock usage tips
In business, nothing should be done off-handedly. This includes utilizing safety stock as an incorrect approach could do more harm than good. Here are some essential tips for a successful implementation.
DO:
- Use safety stock to mitigate risks stemming from demand and lead time uncertainties.
- Use it as part of your larger inventory management strategy. Utilize safety stock concurrently with demand forecasts, reorder points, and economic order quantity (EOQ). Accurate forecasts ensure that you do not have to dip into your safety stocks because of foreseeable demand increases, reorder points enable timely inventory replenishment, and EOQ makes sure your purchase orders strike a balance between ordering costs, carrying costs, and product availability.
- Find a balance between service levels, customer availability rate, and carrying costs. While keeping a lot of buffer ensures that your service levels and availability rates are at 100%, this would substantially increase carrying costs.
- Use mathematical formulas to define optimal safety stocks for your materials. There are many different safety stock formulas for many different situations and circumstances.
- Regularly review your buffer inventory levels. As market conditions and business needs change, buffers need to be periodically reassessed and adjusted.
DON’T:
- Use safety stock to mask issues in inventory management, forecasting, production, logistics, or supplier performance. This will lead to problems much larger than just overstocking.
- Keep insufficient safety stock. You will risk being unable to fulfill orders, which could result in lost sales and customer turnover.
- Keep too much buffer. You will most probably keep customers happy, but a higher level of safety stock immediately means higher inventory costs, extra cash tied up in inventory, and spoiled, expired, or damaged goods in due time. Don’t let your buffer stock become excess inventory.
- Rely on buffer stock for seasonal demand. Safety stock should only be used to handle the unpredictable.
When adding safety stock to your inventory management strategy, following these basic tenets will ensure an effective implementation.
How to calculate safety stock?
There are many different ways to calculate the perfect amount of inventory to keep as a buffer. The method of choice depends entirely on your specific needs and circumstances. Here are some safety stock formulas, starting from the simplest.
Two simple safety stock formulas
For both of these simple formulas, you’ll need to know the:
- Average lead time in days (LTavg)
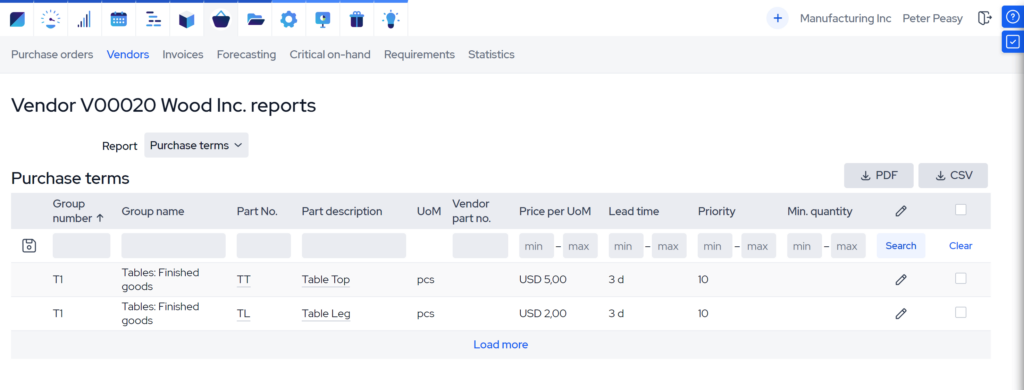
Your vendor’s average lead time is the average time it takes from putting in a purchase order to the arrival of goods.
You can pull that data from the Procurement -> Vendors -> A vendor’s reports -> Purchase Terms report or by analyzing your previous Purchase Orders at Procurement -> Purchase Orders section of your MRP system.
- Average demand per day (Davg)
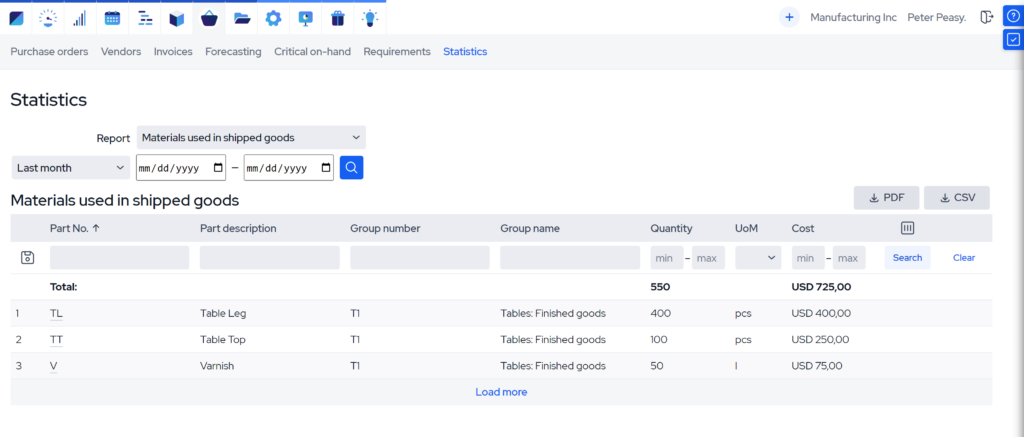
To get your average demand, just pull the statistics from the Procurement -> Statistics section of your MRP system.

In this example, we have used 100 pieces of tabletops in a quarter, that is, on average, 66 working days. So we’ll divide the number of items consumed by the number of days to get the average daily usage.
100 / 66 = 1.5
The average demand for tabletops is 1.5 per business day.
The Basic Formula
This is the easiest and most inaccurate method (other than just improvising) to determine safety stock.
Safety Stock = Average Demand x Safety Days
To use it, you will have to predetermine the number of safety days you’re going to need to be able to respond to a spike in demand or inconsistencies in supply.
Let’s say you use 1.5 units of tabletops per day and your vendor’s average lead time is 5 business days. Based on previous experience, you set the safety net at 10 days. This means the tabletop’s buffer should be:
Safety Stock = 1.5 x 10 = 15 units
WARNING: This method is not the most accurate due to the necessary safety days being derived from experience, not from rigid data analysis.
The Average – Maximum Formula
To calculate safety stock by using the average-maximum formula, you need to know your stock keeping units’ (SKUs) maximum lead times as well as their maximum demand.
Safety Stock = (LTmax x Dmax) – (LTavg x Davg)
You can determine your maximum lead time by looking at your Procurement -> Purchase orders section in your MRP system. Tick the box for “Delay” from the “Choose columns” drop-down menu.
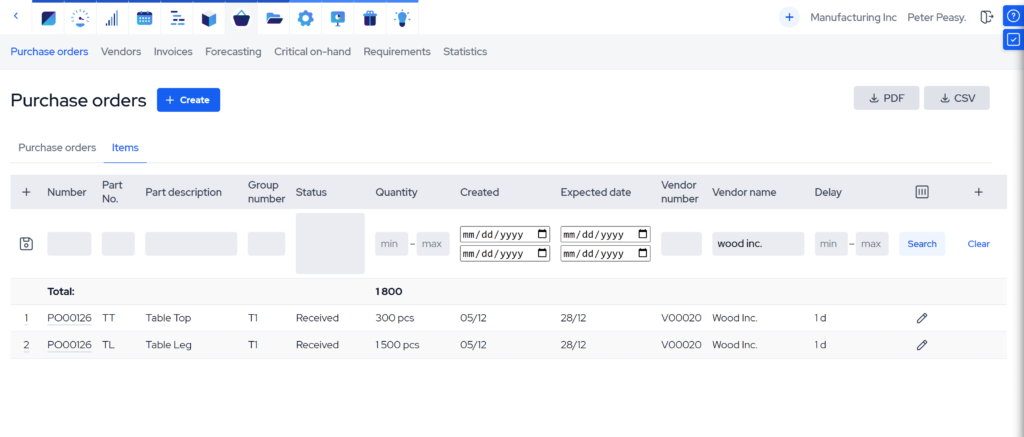
Then add the average lead time to the largest delay of the SKU you are trying to calculate safety stock for.
Now you have the SKU’s maximum lead time.
You can find the maximum demand similarly. Just take the month-by-month data from your Procurement -> Statistics section.
Let’s say you use 100 units per month on average, but your maximum monthly use this year has been 130 and your average lead time is 5 days, but the maximum has been 6. Now, convert the monthly demand to demand per business day.
There are 22 business days each month on average, so the average demand is 100/22 = 4.55 units/day, and the maximum daily usage is 130/22=5.91 units/day.
That means your safety stock should be:
(6 x 5.91) – (5 x 4.55) = 35.46-22.75 = 12.71
Let us round it up and that makes your optimal safety stock 13 units.

Formulas for specific variables
Here is where we will start applying some proper math.
Apart from the SKU’s average lead time and average demand, for the following formulas, you will have to know:
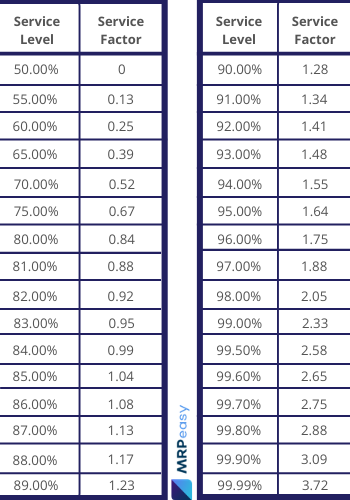
- Service level factor (Z). The service level shows the percentage of cases when you can continue normal business despite any disruptions, i.e. you do not run out of stock. For example, service level 95% means that in 5% of cases, your materials will arrive so late that the safety stock has been exhausted, and thus, production (and/or sales) has stopped. According to the desired service level, choose the Z-factor from the following table.
- Lead time standard deviation (σLT). You can find the standard deviation in lead times by looking at your average lead time and your actual lead times. Get your actual lead times by comparing the Expected Dates with the Arrival Dates and adding the difference to the average lead time of the vendor.
Here’s an example:
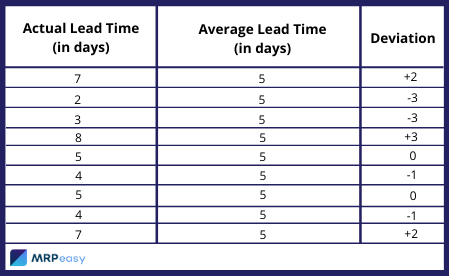
We find that the standard deviation of the lead time is 2 days (function STDEV can be used in Excel and Google Sheets to calculate it based on a sample).
- Demand standard deviation (σD). The standard deviation of demand can be calculated by using the example from lead time standard deviation – just replace the Actual Lead Times with Actual Demand per day, and the Average Lead Time with Average Demand per day. See the day-to-day “Materials used in shipped goods” statistics to find the Actual Demand.
Always remember to use the same units of time measurement throughout your equations, e.g. only days or only months, otherwise, your results will be unusable.
Using the previous examples, let’s say that the data we use to exemplify the following formulas is as follows:
- Average demand per day (Davg): 1.5 units
- Average lead time in days (LTavg): 5 days
- Service factor (Z): Assuming a service level of 95% (Z-score approximately 1.65)
- Lead time standard deviation (σLT): 2 days
- Demand standard deviation (σD): Assume 0.5 units
Formula for lead time variability
In case you have consistent demand but inconsistent lead times, you can calculate your necessary buffer with this equation.
Safety Stock = Z x σLT x Davg
Using the data specified above, we arrive at a buffer stock of:
Safety Stock = 1.65 x 2 x 1.5 = 4.95 units
Let’s round up the result to 5 units of buffer stock.
Formula for demand variability
If your lead times are like clockwork but demand fluctuates, use this formula to calculate your buffer inventory.
Safety Stock = Z x √LTavg x σD
Using the data specified above, we arrive at a buffer of:
Safety Stock = 1.65 x √5 x 0.5 = 1.65 x 2.24 x 0.5 = 1.85
Let’s round up the result to 2 units of buffer.
Formula for independently variable demand and lead times
If both your sales and lead times vary independently of each other, you can use this formula for your calculations.
Safety Stock = Z x √[(LTavg x σD^2) + (σLT x Davg)^2]
In conditions of independently variable demand and lead times, the company should therefore keep this much safety stock:
Safety Stock = 1.65 x √[(5 x 0.5^2) + (2 x 1.5)^2] = 1.65 x √[(5 x 0.25) + 3^2] =
= 1.65 x √(1.25 + 9) = 1.65 x √10.25 = 1.65 x 3.2 = 5.28
Let’s round up the result to 6 units to maintain the optimal service levels.
Formula for dependently variable demand and lead times
In case your demand and lead times fluctuate while being dependent on each other, use this formula.
Safety Stock = (Z x √LTavg x σD) + (Z x σLT x Davg)
In conditions where demand and lead times vary dependently of each other, the company should hold this much as a buffer:
Safety Stock = (1.65 x √5 x 0.5) + (1.65 x 2 x 1.5) = (1.65 x 2.24 x 0.5) + (1.65 x 2 x 1.5) =
= 1.85 + 4.95 = 6.8
Let’s round up the results to a buffer stock of 7 units.
Conclusion
Calculating safety stock is an essential aspect of effective inventory management, tailored to a company’s unique needs and market conditions.
The methods range from basic formulas, like multiplying average demand by safety days, to more sophisticated approaches considering maximum demand and lead times, as well as variable lead times and demand. Each method has its place, with the choice dependent on the specific situation of the business.
It’s crucial to regularly review and adapt these calculations to changing market dynamics and internal processes. Ultimately, the right buffer stock calculation aligns with the company’s operational efficiency and customer satisfaction goals, striking a balance between overstocking and the risk of stockouts.
Source of formulas: Crack the Code, P. King, APICS Magazine (2011)
Key takeaways
- Safety stock is the extra inventory held to mitigate risks of stockouts due to supply disruptions or demand spikes.
- A key component in both raw material and finished goods inventory management, safety stock plays a vital role in preventing shortages, ensuring customer satisfaction, smoothing the production process, and mitigating supply chain variability.
- Regular data analysis and inventory management practices are crucial to maintain optimal safety stock levels, thereby avoiding both stockouts and overstocking.
- Companies should avoid using safety stock to mask poor inventory management practices, forecasting issues, and supplier inconsistency.
- Key data needed to calculate the optimal amount of safety stock includes average lead time, average demand, service level factor, and standard deviations of lead time and demand.
Frequently asked questions
Safety stock is calculated using formulas that account for average lead time, average daily demand, and variability in demand and supply, with more complex calculations incorporating factors like service level and standard deviations.
A good amount of safety stock varies based on individual business needs and factors like demand variability, supplier reliability, and lead time, aiming to balance the risk of stockouts with the cost of holding excess inventory.
Safety stock is a regular buffer against normal fluctuations in demand and supply, while emergency stock is an additional reserve for unforeseen, extreme disruptions or emergencies in the supply chain.
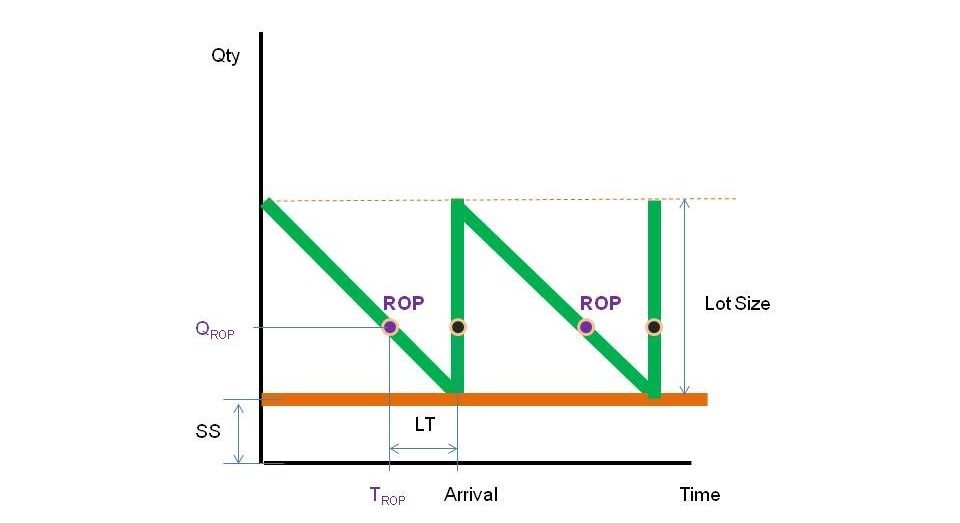
No, safety stock is a buffer above the regular stock to prevent stockouts, whereas minimum stock (also known as reorder point) refers to the lowest inventory level before a new order must be placed to replenish stock.
You might also like: ABC Analysis in Inventory Management