How to Calculate Overall Equipment Effectiveness (OEE)?
Overall Equipment Effectiveness or OEE is a KPI that measures how effectively machines and equipment in a manufacturing facility are operating. Tracking the OEE allows for the identification of potential issues that may be impacting production efficiency.
What is Overall Equipment Effectiveness (OEE)?
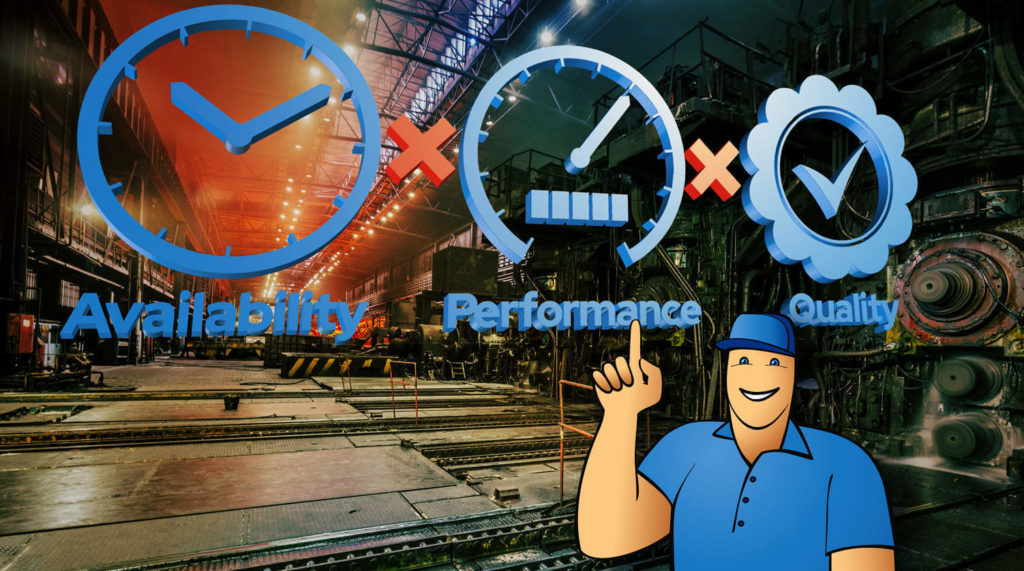
Overall Equipment Effectiveness (OEE) is a manufacturing KPI that measures the efficiency achieved in a production process, specifically how effectively machines and equipment are operating. In the most basic terms, OEE is the ratio between the following factors:
- Availability or how much time your equipment was running during a period (also called uptime).
- Performance or the number of workpieces produced per period (also called process rate).
- Quality or the percentage of completed workpieces that have passed inspections (also called yield).
Presented as a percentage of the ideal, Overall Equipment Effectiveness gives an indication of how much it is possible to raise efficiency in the production process.
Why is Overall Equipment Effectiveness important?
Overall Equipment Effectiveness is one of the best key performance indicators to track in manufacturing. That is because it gives managers a very good sense of the performance of the production department while taking many aspects into consideration.
Tracking OEE allows you to:
- Understand how efficient the production process is
- See if things are getting better or worse over time
- Compare the performance of multiple workstations
- Discover areas that can be improved
For example, breaking the OEE back down into its three components allows you to see whether a single area is having a negative effect on the overall efficiency.
But let’s first understand how to calculate OEE and then dive into the specifics of how to use it.
How to calculate Overall Equipment Effectiveness?
As said above, Overall Equipment Effectiveness consists of three underlying measures: Availability, Productivity, and Quality. Each of those three measures has been designed so it would exclude the effects of the other two.
Availability
Availability shows the pure uptime or the time the workstation or machine was actually operating. It is represented as a percentage of the ideal scheduled time, with availability losses accumulating due to events such as setup and warmup, adjustments, and breakdowns.
Availability = Real Run Time / Planned Time
For example, if a production schedule specified a 10-hour run time per day, but setup and warmup took 30 minutes and during the day six adjustments had to be made, each eating away 10 minutes, then the real run time is 8.5 hours.
The availability rate is, therefore:
8.5 / 10 = 0.85 = 85%
That means the workstation was available 85% of the time.
Performance
Performance, also known as process rate, measures the speed at which the workstation or machine processes units. It is also represented as a percentage of the ideal, with performance losses being caused by logistical problems, searching for tools, small stops, operator inefficiency, decreased speed of the machine, etc.
Performance = (Total Units x Ideal Cycle Time) / Real Run Time
Let us continue with the previous example and say that from the 10-hour shift, a machine had a real run time of 8.5 hours. Let’s say that the ideal cycle time per unit is 3 minutes (0.05 h) and the workstation processed a total of 140 units in those 8.5 hours.
The performance rate is, therefore:
(140 x 0.05) / 8.5 = 0.82 = 82%
That means the machine ran at 82% of its ideal speed.
Quality
The quality in OEE, also called process yield, represents the good units processed as a percentage of the total units. Quality losses are incurred, for example, due to startup losses and defects.
Quality = Good Parts / Total Parts
Let’s continue the previous example, where a total of 140 units were processed during an 8.5-hour run time. Out of those 140 units, 135 were without defects.
The quality rate was, therefore:
135 / 140 = 0.96 = 96%
That means 96% of the processed units were without defects.
Overall Equipment Effectiveness
Now we can finally calculate the OEE using the formula:
OEE = Availability x Performance x Quality
With numbers from the previous examples, we will arrive at an OEE of:
85% x 82% x 96% = 67%
The total efficiency of the workstation was therefore 67%. Now we can analyze and identify areas for improvement.
How to use OEE to improve your business?
Overall Equipment Effectiveness can be a tremendous help in detecting problem areas and bottlenecks in the production process.
It allows you to compare multiple pieces of equipment against each other and see how they perform in different situations. This helps you identify opportunities for improvement across the board. For example, if one piece of machinery has an OEE score that’s significantly lower than others, it may indicate that there are issues with how it’s being operated or maintained—and those issues should be addressed before they become serious problems.
Looking into the underlying metrics – Availability, Performance, and Quality – could help pinpoint the areas which need to be dealt with:
- If availability is low, you need to optimize setup times, do preventive maintenance, etc.
- If performance is low, you need to prevent small stops and delays, improve operator efficiency, etc.
- If quality is low, you need to minimize startup losses and other defects.
The goal is to make processes better by defining a metric that shows the overall health and progress of the operation. All employees who have access to the indicators should be educated on the essence of OEE and its underlying metrics and how they could personally help raise it.
It is important to note that OEE and its underlying metrics can only be used for benchmarking a factory against itself, not with other factories as the underlying measures could vary greatly and there is no industry standard. It’s also not a tool in itself that can make things better, it’s merely an important gauge that reflects the situation. It’s the factory workers who need to understand what OEE tells them and act appropriately.
OEE improvement goals should be set conservatively – not 30% a year but perhaps 3% a year. Even a single percentile of growth can be a huge step forward and would require reevaluations of old processes, implementation of new ones, and educating staff. It is continuous improvement that matters.
Without tracking OEE over time, you won’t know if your efforts are paying off—or whether there’s another way you could use your resources more effectively. Tracking OEE regularly provides useful data about the effectiveness of your operation and shows you where there might still be room for improvement.

What is TEEP and how to calculate it?
TEEP is a measure of equipment performance that is tightly connected to OEE. It’s used to indicate the total efficiency of a workstation and how much the production output of a workstation can be raised, taking into account the OEE as well as the total potential run time, i.e. 24 hours per day, 168 hours per week, etc.
The TEEP formula involves four key components: availability, performance, quality, and utilization. Therefore, the TEEP formula is:
TEEP = OEE x Utilization
Utilization refers to the percentage of the time that a machine is planned to be running vs. the total time available in a period.
Utilization = Planned Time / Total Time
Continuing the previous OEE example of one day (24 hours) with a single 10-hour shift, we will arrive at the following utilization rate:
10 / 24 = 0.42 = 42%
With our previously calculated OEE of 67%, the TEEP will be:
67% x 42% = 28%
That means the workstation is running at 28% efficiency.
Apart from increasing the OEE, the facility could add another 10-hour shift or create three 8-hour ones in order to increase the TEEP. If you are already running 24/7, then TEEP is equal to OEE.
Tracking these two metrics, OEE and TEEP, side-by-side along with their underlying indicators – Availability, Performance, Quality, and Utilization – gives a good overview of the overall health of the production and indicates the direction the company is heading. These can be important metrics that help make decisions on what to do next and where to turn the attention.
OEE in manufacturing ERP software
Although the calculations above seem quite clear-cut and simple, calculating the OEE and TEEP of every single workstation consistently is a time-consuming and error-prone task, especially when done using manual reports.
Manufacturing ERP systems, however, are designed to collect precisely the data needed for OEE calculations. If you want a system that helps you track the production data required for OEE calculations, you should look for functionality such as shop floor reporting (with time and unit tracking) and quality control.
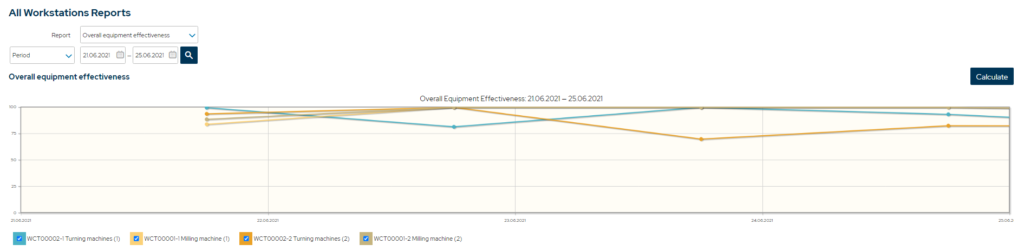
The best ERP systems with shop floor software functionality even automatically calculate the OEE and generate visual graphs that allow you to easily track your OEE changes during specified periods. Provided with this quickly and easily accessible information, you can make the necessary corrections much sooner and improve the efficiency of your operation at a faster rate.
Key takeaways
- Overall Equipment Effectiveness (OEE) is a KPI that measures how effectively machines and equipment are operating in manufacturing.
- OEE is a ratio between availability, performance, and quality.
- Tracking OEE allows manufacturers to know their production efficiency and how much it could be raised and where, as well as how it has changed through time.
- If availability is low, you need to optimize setup times, do preventive maintenance, etc.
- If performance is low, you need to prevent small stops and delays, improve operator efficiency, etc.
- If quality is low, you need to minimize startup losses and other defects.
- OEE can only be used for benchmarking the business against itself, not other businesses.
- TEEP or Total Effective Equipment Performance is a metric that is used to measure how much the production output could be raised.
- Using a manufacturing ERP system allows companies to track OEE and TEEP effortlessly.
You may also like: Capacity Utilization – A Simple Guide