What Is the ROI of an MRP System and How to Calculate It?
Many small manufacturers think implementing MRP software would be too expensive for them. To put their minds at ease, we have compiled a small guide to calculating the Return on Investment of an MRP system.

Why is it important to estimate ROI before making an investment?
Many small companies constantly postpone deciding whether to invest in an MRP system or not as they are struggling to estimate the Return on Investment. There is a widely spread misconception that ROI cannot be estimated for an investment when it comes to digital solutions, however, this is not true. Another common mistake is the belief that positive results are guaranteed regardless of which digital solution is implemented. In reality, there are high risks of investing in the wrong features, overinvesting, or investing too little, which leads to an exceptionally long Return on Investment or even to reduced productivity.
Similar trends where not all investments yielded positive results were, observed in the 70s and 80s of the previous century at the peak of automating production processes when, in many cases, the rise of productivity was far below the expected. Dr. Armand Feigenbaum, an American quality control expert, described this phenomenon in his interview with Industry Week by saying “After 10 or 15 years of automation-computerization – if anything, we have increased the ‘Hidden Factory’.”
Hidden Factory is a term coined by Armand Feigenbaum. It refers to the activities in a manufacturing process that decrease the quality and efficiency of an operation. Thus, it is essential to thoroughly study the potential gains before making an investment decision.
How to calculate the ROI of an MRP system?
How to calculate the effect of MRP on productivity and EBITA (earnings before interest, taxes, and amortization)? Firstly, let’s shift the paradigm. Neither MRP nor any other digital solution can have a direct influence on profitability or productivity without the company making changes in its processes at the same time.
Higher productivity can be achieved by streamlining the production process and reducing ‘Hidden Factory’, where MRP plays a crucial role in creating the conditions that enable the streamlining of a process. In this article, you will find a simple yet powerful 8-step process that allows you to estimate the gains that you can achieve with the implementation of MRP.
Before getting started, you should set metrics to monitor your company’s performance. Becoming profitable is often used as one of the metrics, which is not necessarily wrong. However, consider that: profit = price – costs. The selling price is largely influenced by a degree of competition and the customer’s willingness to pay for a specific product, whereas cost is fully under the company’s control.
There are 3 universal metrics that apply to enterprises, regardless of their size or the sector they are working in:
- Cost. If the competition becomes much fiercer and you are forced to go along with the market’s overall price competition, reducing the cost allows you to maintain the profit.
- Rate of defects. Defects create the ‘Hidden Factory’ that consumes your resources and reduces productivity.
- Lead time. Lead time, in my opinion, is the most underestimated metric. Lead time has an influence on both components of profit – price and cost. The longer the products spend in your production, the more non-value-added tasks are needed and the higher the cost. At the same time, shortening the lead time will not only reduce costs, but will also create a competitive advantage and, as a result, provides an opportunity to increase the price.
Thus, the idea behind calculating the ROI of MRP is to estimate how well MRP can facilitate necessary improvements by increasing the effectiveness and efficiency of the processes. Effectiveness measures how many of the activities are necessary to achieve the end result. These necessary activities are called value-added activities. Efficiency measures how well the task is being performed.
8-step process to calculate ROI of MRP
Step 1. Map your current process.
To make improvements, you need to get a full understanding of your current processes. More often than not, managers know exactly what the necessary value-added steps are to get a product from raw material to finished goods, but at the same time, they lack knowledge of non-value-added tasks hidden in between. A mapping process helps to reveal non-value-added tasks or waste.
Step 2. Identify the non-value-added tasks and the inefficiencies in your process.
According to the Lean Operational Excellence Strategy, any work or task performed can be classified into one of three categories: value-added work, non-value-added work, and pure waste or Muda.
For a task to be considered as value-added, it must meet 3 criteria: Firstly, the task must create value for the customer (or the customer must be willing to pay for it) Secondly, the task shall change the form, fit, or function of the product. Thirdly, the task must be completed right the first time. Thus, your goal is to identify non-value-added activities and waste and eliminate them from the process.
Some non-value-added tasks are required to support the execution of value-added tasks. These supporting tasks are often referred to as auxiliary tasks. Look at the possibilities to execute these auxiliary tasks in a way that they would have minimal effect on the performance and cycle time of the value-added tasks. A well-known example comes from Toyota, where changing dies at the die press used to take up to 3.5 hours. Over time, engineers managed to reduce the time required for changing the dies to just 3 minutes.
Here is a quick introduction to how to reduce the impact of auxiliary tasks on the effectiveness of the operation.
All tasks taken while performing an operation can be separated into ‘internal tasks’ and ‘external tasks’. An ‘internal task’ can only be done when a machine or automated process has been stopped. Whereas an ‘external task’ can be done at the time when the machine or automated task is running.
For example, think of a machining workstation of a make-to-order manufacturer, where the parts are worked on a CNC machine. To complete the operation, the operator must go through a series of tasks. These are: extract the completed part from the machine, place it on the chart and label it, identify a new task to be completed and locate the next part to be machined, place it into the CNC machine, load a cutting file for the next part, and complete machining.
Extracting the completed part and loading the next part into the machine are clearly ‘internal tasks’, as they can be performed only when the machine is stopped. All other tasks – placing the completed part on the chart and labeling it, identifying new tasks and locating the associating next part, and loading the cutting file for the next operation – might be currently ‘internal tasks’ as well, but many of them can be performed at the time the machine is working. Meaning some, if not most of today’s ‘internal tasks’ can be transformed into ‘external tasks’. Your goal is to identify options on how to move as many ‘internal tasks’ as possible into ‘external tasks’.
Step 3. Capture the current state of your performance metrics.
Above we discussed the company-level metrics – cost, lead time, and number of defects. At the workstation or on the operation level, appropriate metrics are operation cycle time, Overall Equipment Effectiveness (OEE), and the number of defects. If you fail to capture these numbers before changing the process, you lose the opportunity to assess the result of made changes.
Step 4. Design a concept of ‘to-be’ process.
Map the first version of your new ‘to-be’ process, where all or at least most of the waste has been eliminated and as many ‘internal tasks’ as possible have been moved into ‘external tasks’.
Step 5. Analyze which pre-conditions are required to implement the ‘to-be’ process.
Some of the pre-conditions can be created by changes inside the organization. For example, changing the factory layout makes it possible to reduce the time spent on transportation and the required energy to move parts from one workstation to another.
Some pre-conditions can be created by technology. For example, to speed up locating the next part to be machined from the WIP storage, it will require an MRP capable to track the location of the parts that are in the storage. To speed up the labeling of parts, it will require an MRP solution capable of printing barcode labels when the completion of operations is reported, and it will require an investment into a label printer. To speed up reporting an operation, it might require an MRP that is capable of printing barcodes on work orders, thus the operator shall only scan the barcode to report operations.
Complete the analysis for all operations in your process. Next, compile the list of solutions and their features that are required for creating ground for streamlining the process.
Step 6. Evaluate available solutions and to what degree they are capable of creating required pre-conditions.
When evaluating the solutions that might aid in creating required pre-conditions, select the ones which have the highest impact on streamlining a process.
Step 7. Finalize the ‘to-be’ process.
Knowing which processes can be streamlined and to which degree and given the features of the selected MRP, draw a final version of the ‘to-be’ process map. Calculate the new throughput rate.
Step 8. Calculate the effect and ROI.
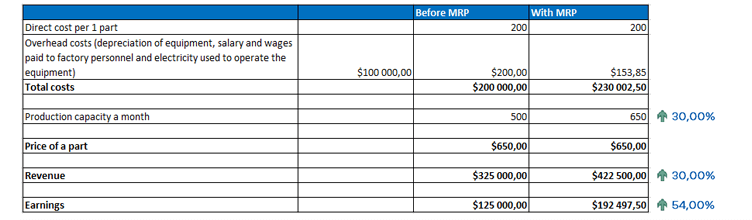
Let’s say your current throughput is 500 finished parts a month and your total manufacturing overhead cost (depreciation of equipment, salary, and wages paid to factory personnel and electricity used to operate the equipment) is $100,000, which makes it $200 for a part. Say, after the implementation of an MRP solution and applying required changes to your process, the estimated throughput will be 650 parts a month.
For the sake of not overcomplicating our example, let’s say changing the process will not change the overhead costs. In this case, the overhead component in the products’ cost structure will reduce from $200 per product to $153.85. That corresponds to 650 times $46.15 = $29,997 cost-saving a month from reduced overhead costs when you reach the expected throughput. Plus, you will have increased profit from revenue growth.
In a similar way, calculate all benefits you will achieve, including reduction of costs related to fewer defects. In our example, see the table below – total results show a 30% capacity increase, a 30% increase in revenues, and a 54% increase in earnings.
Now calculate the total investment needed for the implementation of MRP, changing processes, and training employees. Calculate the monthly depreciation of investment for one manufactured product. If you select an MRP with a monthly payment plan, it should be a straightforward calculation.
Let us take an example where total project costs, including the purchase of new devices, MRP software, the cost of hiring the project manager for the implementation project, and the costs of temporary stoppages of production to apply changes, are $75,000. In this case, the optimistic ROI of the MRP solution would be just above 1 month. As getting used to the new procedures and new software will require a learning curve, the realistic result for the first month usually falls somewhere in between 70% and 85% from an optimistic point of view.
What benefits will the above-described process provide?
By following the above-described 8 steps, you will have facts to make decisions regarding which features in your ‘to-be’ process require an MRP solution. It will also give you a roadmap to select a solution that fits your needs. You can make a data-driven decision based on which process changes are worth making given your current available options. You can prioritize changes that will have a higher payback.
As a cherry on top, in the process, you will discover “low-hanging fruit” changes that can be achieved very easily and quickly, often requiring no investment at all.

Key takeaways
- Many manufacturers struggle with estimating the ROI of an ERP/MRP system.
- ROI can be estimated for any solution, including digital ones.
- The positive results of implementation, however, depend on the company’s ability to change its processes.
- MRP systems play a crucial role in creating the conditions for streamlining processes.
- The three basic metrics to monitor in any business are: profit, defects, and lead time. When implemented well, an MRP system can facilitate improvements in all of them.
- There are eight steps to calculating the ROI of an MRP system:
1. Map your current processes
2. Identify non-value-added tasks and inefficiencies
3. Capture the current state of your performance metrics
4. Design a concept of “to-be” process
5. Analyze which pre-conditions are necessary for achieving the “to-be” process
6. Evaluate available options and their ability to create the necessary pre-conditions
7. Finalize the “to-be” process
8. Calculate the effect and ROI - Usually, an MRP system’s ROI is between 70% and 85% for the first month.
- This process of estimating the ROI aids you in reviewing your processes and gives you an idea of what kind of a software solution you need.
- It also reveals “low-hanging fruits” – changes in the process that can be achieved easily and without extra investment.
This guest article was written by Edward Laur, CEO of consulting company Laur & Partners.