Top 10 Manufacturing KPIs in 2024
The goal of every manufacturing business is to be as efficient as possible. But without being able to accurately gauge your efficiency, it is hard to know where you stand and what goals to set. Here is where manufacturing KPIs come into play.

You can also listen to this article:
What is a manufacturing KPI?
Manufacturing KPIs or Key Performance Indicators are metrics that are tracked in order to understand the efficiency of various vital functions within a manufacturing company.
Even though all KPIs are metrics, not all metrics get to be KPIs. The difference between the two lies in their purpose. While both are quantifiable measures of performance in one area or another, the term “metrics” encompasses every single value you can measure. KPIs or Key Performance Indicators, however, are related to specific business goals you have set, making these metrics key indicators of success or failure.
Tracking a huge number of metrics without really thinking about their value to your business is therefore mostly a waste of time. Setting certain goals and tying them to metrics, however, is a surefire way to accurately measure your progress and improve the processes in question.
Selecting the right manufacturing KPIs
There is a reason why KPIs are “Key” Performance Indicators. Although you can use any type of metric to gauge any kind of performance, KPIs are those that matter the most. And what is important to companies may vary greatly depending on the sector they operate in.
Generally, a company should not track more than ten manufacturing KPIs in order not to overly complicate matters. These ten metrics should then reflect different areas of the business: manufacturing efficiency, customer satisfaction, lead times, etc.
Every company has to determine its KPIs according to the nature of its business, but each of those metrics needs to meet a set of criteria for them to turn out useful.
A good manufacturing KPI:
- Reflects strategic goals. Before you select a KPI to track, you need to know what you want to achieve. After setting a target, the KPI should help measure your advancement toward that goal.
- Is quantifiable and measurable. As already said, there is no way to track your progress when there is no concrete way to measure it. Goals need to be as specific as possible for the KPIs to bring value to the business.
- Is attainable and actionable. There is no sense in setting unattainable goals just as there is no sense in tracking vanity metrics that do not actually reflect the state of your business.
How to use manufacturing KPIs?
With good manufacturing KPIs in place, you can make better use of production capacity, increase productivity, improve product quality, improve delivery times, minimize waste, and control costs.
But it is also important to know that manufacturing KPIs might constantly change. Some metrics are more important during one period of company development and when this period ends, others become more important.
For example, for a new manufacturing operation, it is important how fast it can ramp up production volumes and keep the momentum going. Then, in the case of an increased number of customer complaints, the manufacturer has to pay extra attention to the quality of the products and the yield.
It is therefore necessary to periodically review the manufacturing KPIs that your business tracks to ensure improvements are made where they are most needed.
In any case, every KPI follows an iterative process to improve processes and reach business goals:
- Measure the KPI;
- Find where performance losses occur over time;
- Find the root cause of the problem;
- Address the issue;
- Re-measure the KPI.
As an additional consideration, note that some of the terms used to define each KPI in this article may vary depending on the author and the particular use within each organization.
Top 10 most important manufacturing KPIs
Even though manufacturers should also keep an eye on universal KPIs like sales revenue, net profit margin, etc., being in the production business also requires tracking specific manufacturing KPIs. Here are some of the most important manufacturing KPIs.
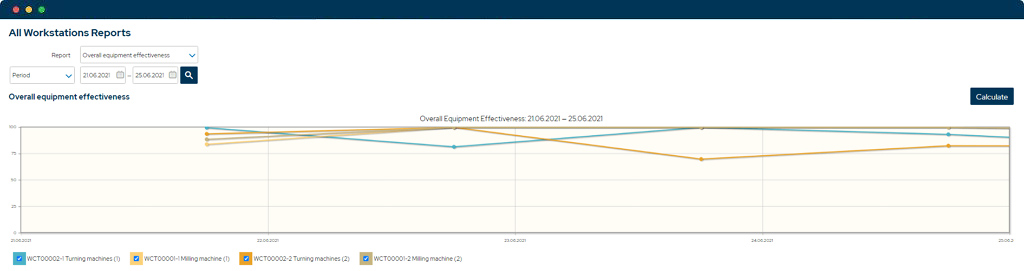
Overall Equipment Effectiveness (OEE)
The Overall Equipment Effectiveness (OEE) is a key performance indicator that enables the production centers to monitor and improve the productivity of a machine or a production line. There are many ways to determine the OEE, one of which is to break down availability, performance, and quality. The OEE has the following formula:
OEE = Availability x Performance x Quality
This means it measures the percentage of time that a machine or production line produces good quality articles during the scheduled time.
Example: A machine was planned to run from 6:00 a.m. to 2:00 p.m. (8 hours) and the standard production rate is 100 units/hour. Suppose there were 30 minutes of machine downtime, and during that 8 hours 700 units were produced, for which only 640 were of adequate quality.
To determine the OEE, we will proceed as follows:
Availability = (8 h – 0.5 h) / 8 h x 100% = 93.75%
Performance = 700 units / (7.5 x 100 units) x 100% = 93.33%
Quality = 640 units / 700 units x 100% = 91.42%
OEE = 93.75% x 93.33% x 91.42% = 80%
Overall Equipment Effectiveness shows the value-added time and highlights the losses. The losses can be defined as the activity that does not add value to the product. There are many categories to classify the losses:
- Machine breakdown
- Employee breaks
- Setup time
- Shortstops
- Speed loss
- Scrap or quality defect
Every operational team should measure and highlight the operational losses and implement countermeasures to increase the OEE.
Work-in-process (WIP)
The Work-in-process (WIP) is a key performance indicator that measures the value of raw materials or subassemblies that have entered the manufacturing process, before obtaining the finished good.
There are two main groups:
- Waiting to be processed
- Being processed
The WIP has the following formula:
WIP = Manufacturing Lead Time x Production Flow Value
Let’s say that a work center takes 5 hours to finish a batch and the production flow rate is in average 100 kg/h at a cost of $1/kg, the WIP will be:
WIP = 5 hours x (100 kg/h x 1 $/kg) = 500$
This means that there is $500 of material in that work center. Following the two main categories, it may be that this material is on any machine or waiting to be used.
Work-in-process inventory depends on the manufacturing lead time and manufacturing costs, the number of orders in process, and the batch sizes. Further analysis will be required by the operational team to determine any way of performance improvement. Among others, such improvement may result in:
- reduction of the manufacturing cost
- reduction of the manufacturing lead time
- optimization of the batch sizes
- optimization of the labor
- increase of space on the shop floor
- enhancement of the transition between the work centers
Read more about Work in Process Inventory (WIP).
Lead Time (LT)
Lead time, also called order cycle time, is an essential KPI for all businesses dealing with the manufacture and sale of products. It gives you an idea of how well your company processes orders and how quickly customer needs are fulfilled. It is the time it takes to fulfill an order from when it is confirmed until the order is delivered in full.
Long lead times can indicate that there are inefficiencies in your business process that cause bottlenecks and rack up unnecessary costs. Short lead times are always ideal because that means there are no obstructions in the process and you can respond to customer needs quickly and efficiently.
The total lead time can be broken down into smaller parts:
- Production lead time is the time the manufacture of a product takes from when production starts until it finishes.
- Delivery lead time is the time it takes to deliver a product to a customer from stock.
- Material lead time is the time it takes for suppliers to deliver goods to the manufacturer.
By breaking down the lead time, you can more accurately pinpoint where the inefficiencies in the process occur.
Read more about Lead Time.
On-time-in-full (OTIF)
The On Time In Full or OTIF is the key performance indicator that measures the number of orders which had been delivered with the right quality and the right quantity on time to the customer. To get the shape of a ratio, it is compared to the total amount of orders.
The OTIF has the following formula:
OTIF = Number of perfect orders / Total number of orders
Let’s assume that an organization has currently 100 orders for delivery today, but:
- 4 orders have not reached the quantity required by the customer
- 3 orders exceed the quantity required by the customer
- 2 orders contain defective products
- 1 order arrived late
Then the OTIF on that day will be:
OTIF = [100 – (4 + 3 + 2 + 1)] / 100 orders = 0.9 = 90%
On Time in Full is a strict KPI that measures the service level of an organization and it involves many functions (commercial, logistics, production, purchasing, etc.). On the other hand, every organization must define the tolerances involved with product defects, quantities per order, and late arrival.
By breaking down the losses, it can highlight:
- Delays within the supply chain
- Product defects
- Shipments with different quantities to the sales order

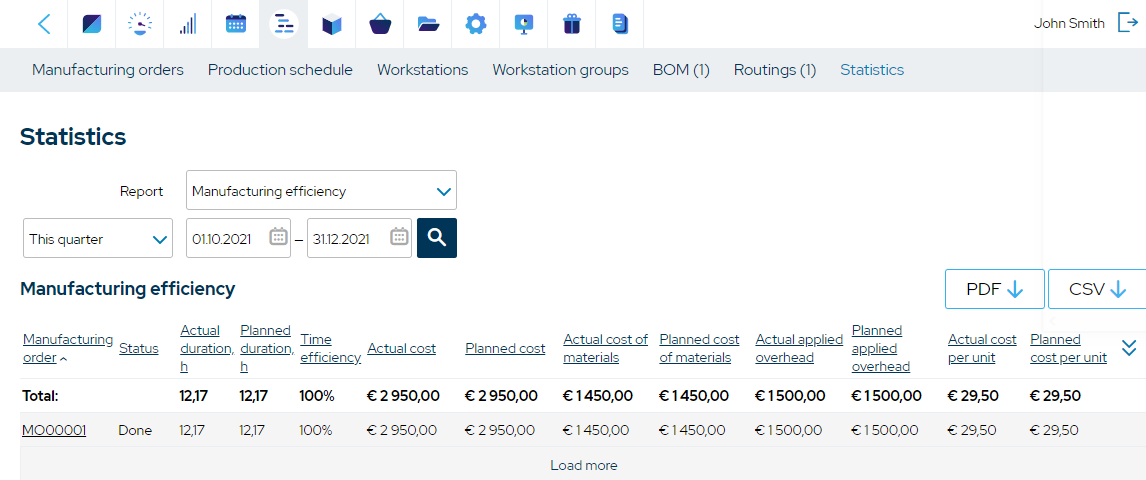
Cost per Unit (CPU)
The cost per unit (CPU) is a powerful key performance indicator that helps a manufacturing system to optimize the cost of the products. It also helps to offer competitive prices in the market and increase the profit of the company.
The CPU has the following formula:
CPU = (Direct Material Costs + Direct Labor Costs + Manufacturing Overhead) / Total units produced
To give a simple example, let’s assume an organization that manufactures 1000 units of a product with the following cost breakdown:
- Direct Material – $3000
- Direct labor – $2000
- Manufacturing Overhead (MOH) – $1000
The CPU will therefore be:
CPU = (3000 + 2000 + 1000) / 1000 = 6 $/unit
There are different methodologies to allocate Manufacturing Overhead when a company produces a mix of products. The methodologies can be standard cost, direct cost, activity-based cost, etc.
It is very important to define the correct allocation methodology. It will help to define how profitable or not a product is and set the price by adding the markup to the total product cost.
Yield or First Time Through
The first time yield (FTY) or first time through (FTT) key performance indicator measures production efficiency and quality. FTT, or Yield, reflects the number of units produced without defects or additional improvements against the total number of produced items.
The formula to calculate this metric is simple:
FTT = (Total Items Produced – Defective Items) / Items Produced
For example, if 5 out of 250 manufactured units were defective, then the FTT would be:
FTT = (250 – 5) / 250 = 0.98 = 98%
Any units that do not meet the quality standards after the production process are considered to be defective items. FTT is usually higher when the production process is not fully set up or when it is done manually.
Production Downtime
Production downtime is a period when the manufacturing process is on hold and no products are produced. Terms such as idle time, downtime, or off-line period usually relate to the same KPI.
Usually, this manufacturing KPI shows a ratio of downtime to operating time and is directly related to the availability of assets for production.
Downtime is a critical metric since if for some reason no goods are being produced, a loss will be incurred. There might be various reasons why the whole production is at a stop, beginning with human factors or mistakes, and ending with broken equipment. It is also a good practice to record the reasons for downtime and try to reduce them in the future.
Inventory Turnover Ratio
Extra inventory means tying up valuable resources. The main idea of manufacturing is to use its space for production, not for storing extra materials and components. The higher the inventory turnover rate is, the more efficiently the supply chain is built.
The inventory turnover ratio formula is:
Inventory Turnover Ratio = COGS / Avg. Inventory
The targets depend largely on manufacturer-specific needs, but as a general rule, the turnover over 30 days could be considered as a long period. If inventory turnover is too high, it indicates inadequate inventory levels, which can cause missed business opportunities. When the ratio is low, it could mean low sales or overstocking, both of which can affect your profits. If sales are low, inventory is not bringing in revenue; if you are overstocking, you are tying up cash that could be used elsewhere in the business.
Read more about the Inventory Turnover Ratio.
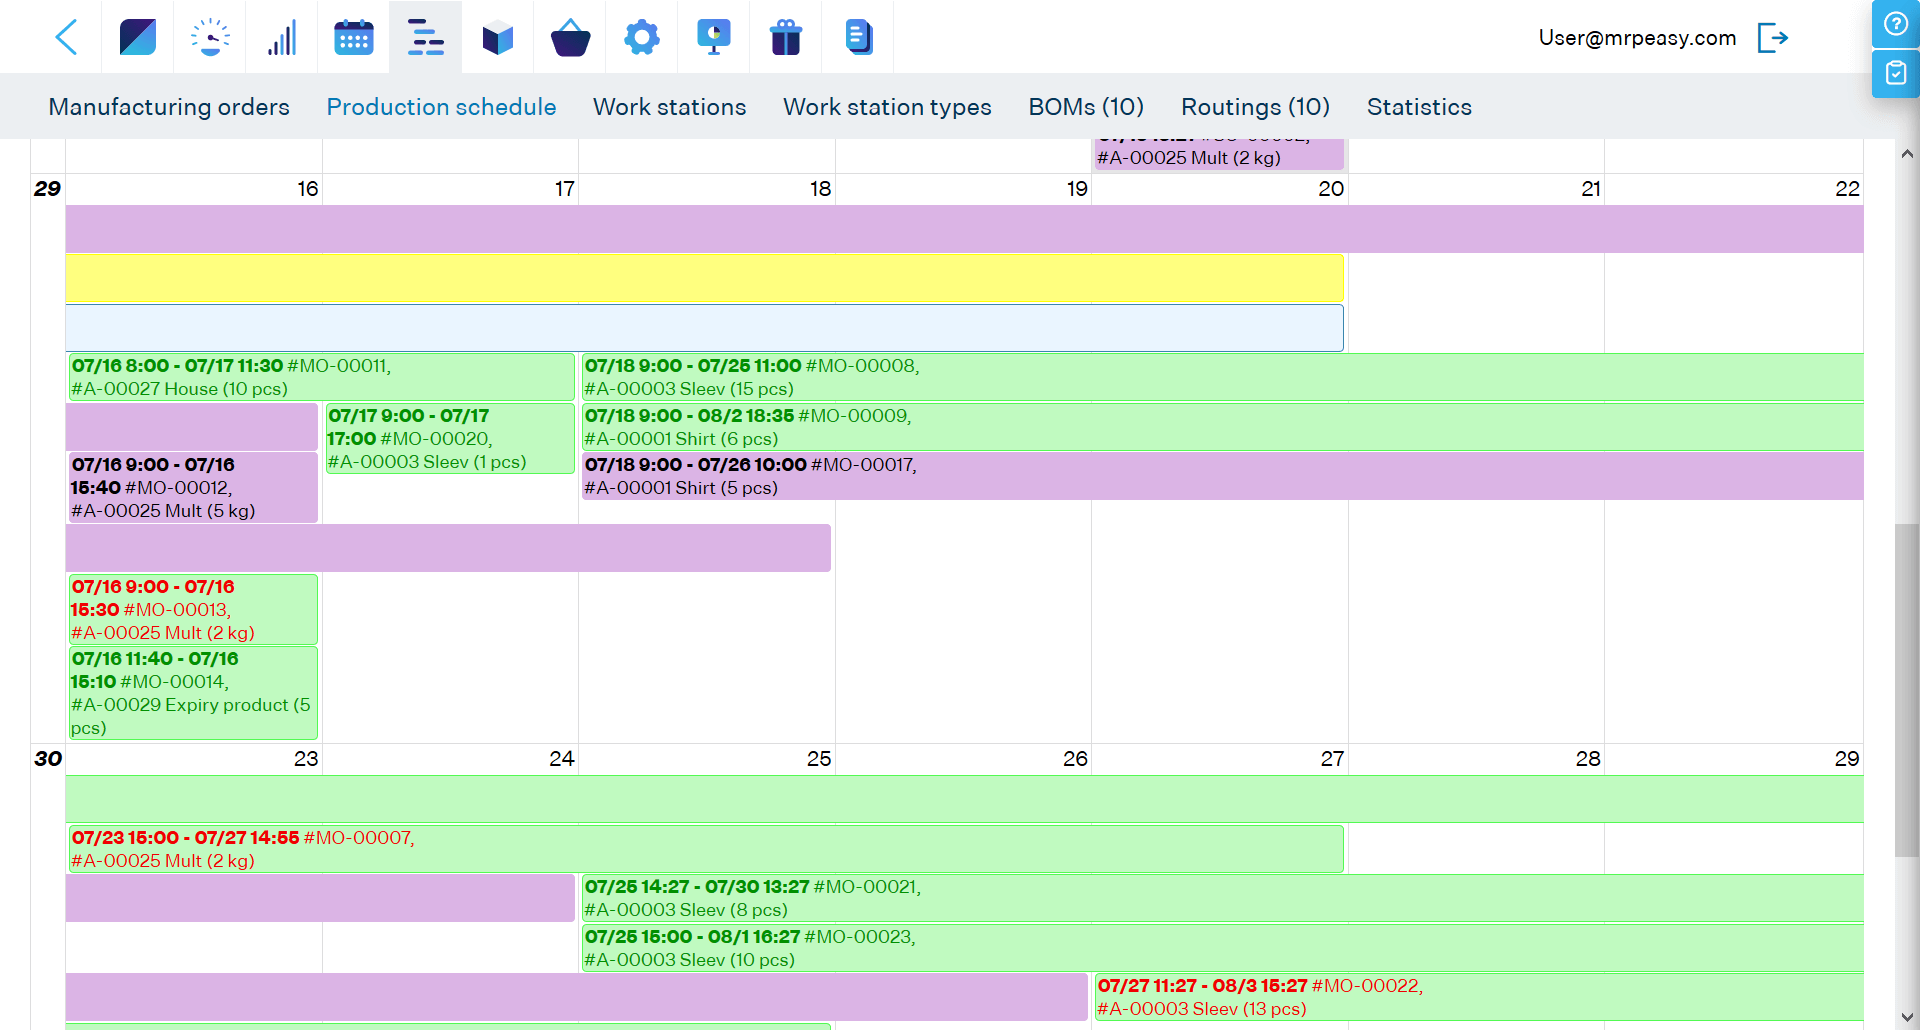
Production Schedule Attainment
This manufacturing KPI reflects how well production is planned and how efficiently the production workers meet their targets. In manufacturing, planning plays an essential role. The more complex manufacturing processes are, the more important the ability to execute the plan becomes. But it also becomes more difficult. Creating accurate production schedules to produce a certain amount of output according to the plan is very important if the manufacturer wants to meet the expectations of the customers and corporate strategy. This manufacturing KPI can be calculated like this:
Production Schedule Attainment = (Actual Output / Planned Output) x 100
For example, when a company plans to produce 4000 units in a month, but actually produces 3500, the PSA is:
PSA = (3500 / 4000) x 100 = 87.5%
By using this KPI, you can set performance benchmarks, improve MO completion time estimates, and increase delivery accuracy.
Supplier OTIF
In manufacturing, a lot depends on the quality of your suppliers. Reliable partners are an essential part of the success of your company, therefore you should also keep an eye on KPIs related to the performance of your suppliers. One of the most comprehensive ways to do this is to measure the On-Time-In-Full of your suppliers.
OTIF = Number of perfect orders / Total number of orders
For example, let us say that your supplier has made 28 deliveries, of which:
- 1 had defective goods
- 3 were late
- 3 had fewer quantities than ordered
Then the OTIF rate for the supplier is:
OTIF = (28 – 1 – 3 – 3) / 28 = 0.75 = 75%
Read more about Supplier Performance Management.
Key takeaways
- Even though all KPIs are metrics, not all metrics get to be KPIs.
- Both KPIs and metrics are quantifiable measures of performance, but KPIs are set apart by their importance to gauging the attainment of business goals.
- Setting business goals and tying them to metrics is key to measuring your progress and improving the processes in question.
- The right KPI should reflect the company’s strategic goals, be quantifiable and measurable, attainable and actionable.
- Generally, a company should focus on a maximum of ten KPIs reflecting different areas of the company.
- With good KPIs in place, a business can improve any area of its operation.
- KPIs should be reviewed periodically and changed according to new goals.
You may also like: What Is Traceability and How to Achieve It?