ABC Analysis (80/20 Rule) in Inventory Management
ABC analysis helps businesses get insight into their supply chain, reduce inventory, and improve inventory management efficiency. And properly applying it does not require a data analyst or a substantial amount of resources.

What is ABC analysis?
ABC analysis is a popular categorization technique used in inventory optimization. It involves classifying stock-keeping units according to a certain criterion, most often by their importance or consumption value, sometimes also by their utilization frequency.
The technique is based on the Pareto principle (or 80/20 rule), which states that roughly 80% of the effects within any system originate from 20% of the causes, meaning that the relationship between inputs and outputs is unequal.
By applying this principle to inventory, we find that a small variety (20%) of inventory items comprise most (80%) of the total inventory value, be it consumption value, sales volume, consumption frequency, or any other criterion.
Knowing which SKUs make up most of your business allows you to set priorities for the items before negotiating prices with suppliers, determining service levels, safety stocks, and reorder points, assigning workers to tasks like inventory review, and physically organizing your stockroom.
Applying ABC analysis in manufacturing and inventory management
ABC analysis has many applications in the realm of manufacturing and inventory management:
- Setting management priorities. ABC inventory analysis helps set management priorities by identifying which items require more management attention. Resources can be allocated more effectively, with A-items receiving the highest level of scrutiny and control, ensuring that investments in inventory management yield the greatest return.
- Applying reordering strategies. By categorizing items, ABC analysis allows companies to apply different reordering strategies for each category. A-items, due to their high value and impact on the business, require more attention and a more frequent replenishment schedule. This ensures that these important items are always available to meet customer demand, thereby optimizing stock levels and reducing the risk of stockouts.
- Determining stocktake frequency. ABC classification significantly influences stocktake frequency. High-value A-items may require more frequent counts to ensure accuracy, given their substantial impact on financials and operations. In contrast, C-items, being less critical, can have less frequent stocktakes, enabling you to save time and resources while still maintaining adequate inventory control.
- Physical optimization of the warehouse. The physical arrangement of the stockroom can also be optimized based on ABC analysis. In this case, SKUs should be categorized based on their movement frequency, i.e. fast-selling or frequently consumed A-items can be positioned for easy access and handling, reducing time and labor in inventory handling. This warehouse organization not only streamlines operations but also minimizes errors and enhances overall efficiency in inventory management.
In conclusion, applying ABC analysis in manufacturing and inventory management provides a structured approach to managing inventory. It enables businesses to focus on the most critical items, streamline their processes, and optimize the use of resources.
Benefits of ABC analysis
As evident from the numerous applications of ABC analysis in manufacturing and inventory management, implementing the technique comes with an array of advantages. These include:
- Prioritizing important items. ABC analysis leads to more efficient management processes by enabling you to focus on high-value items and ensure sensible resource allocation.
- Improved inventory accuracy. Determining your A-category items allows you to cycle count these goods more often than other category items. This improves inventory accuracy for those items deemed most important for the business.
- Reduced risk of stockouts and excess inventory. Employing more stringent supply chain management practices for your A-items helps avoid shortages of goods most valuable for the business. On the other hand, ABC inventory enables you to reduce the inventory levels of C-category items.
- Lower inventory costs. ABC inventory management helps companies identify C-items that are typically low-value but high in quantity. Reducing this type of inventory directly helps reduce carrying costs, free up capital, improve cash flow, and bolster the bottom line.
- Targeted forecasting. The ABC classification allows businesses to focus on A-items, i.e. the goods that significantly impact customer demand. This targeting helps companies make sure that high-value items are readily available, aligning inventory levels with market needs.
Proper ABC inventory analysis, therefore, could have a great effect on your overall inventory efficiency. By focusing on optimizing stock levels and replenishment strategies for high-priority items, businesses can improve inventory turnover, ensuring efficient use and management of their inventory.
How to conduct an ABC analysis
While ABC inventory analysis may seem a daunting task at first, using this step-by-step guide will help you succeed.
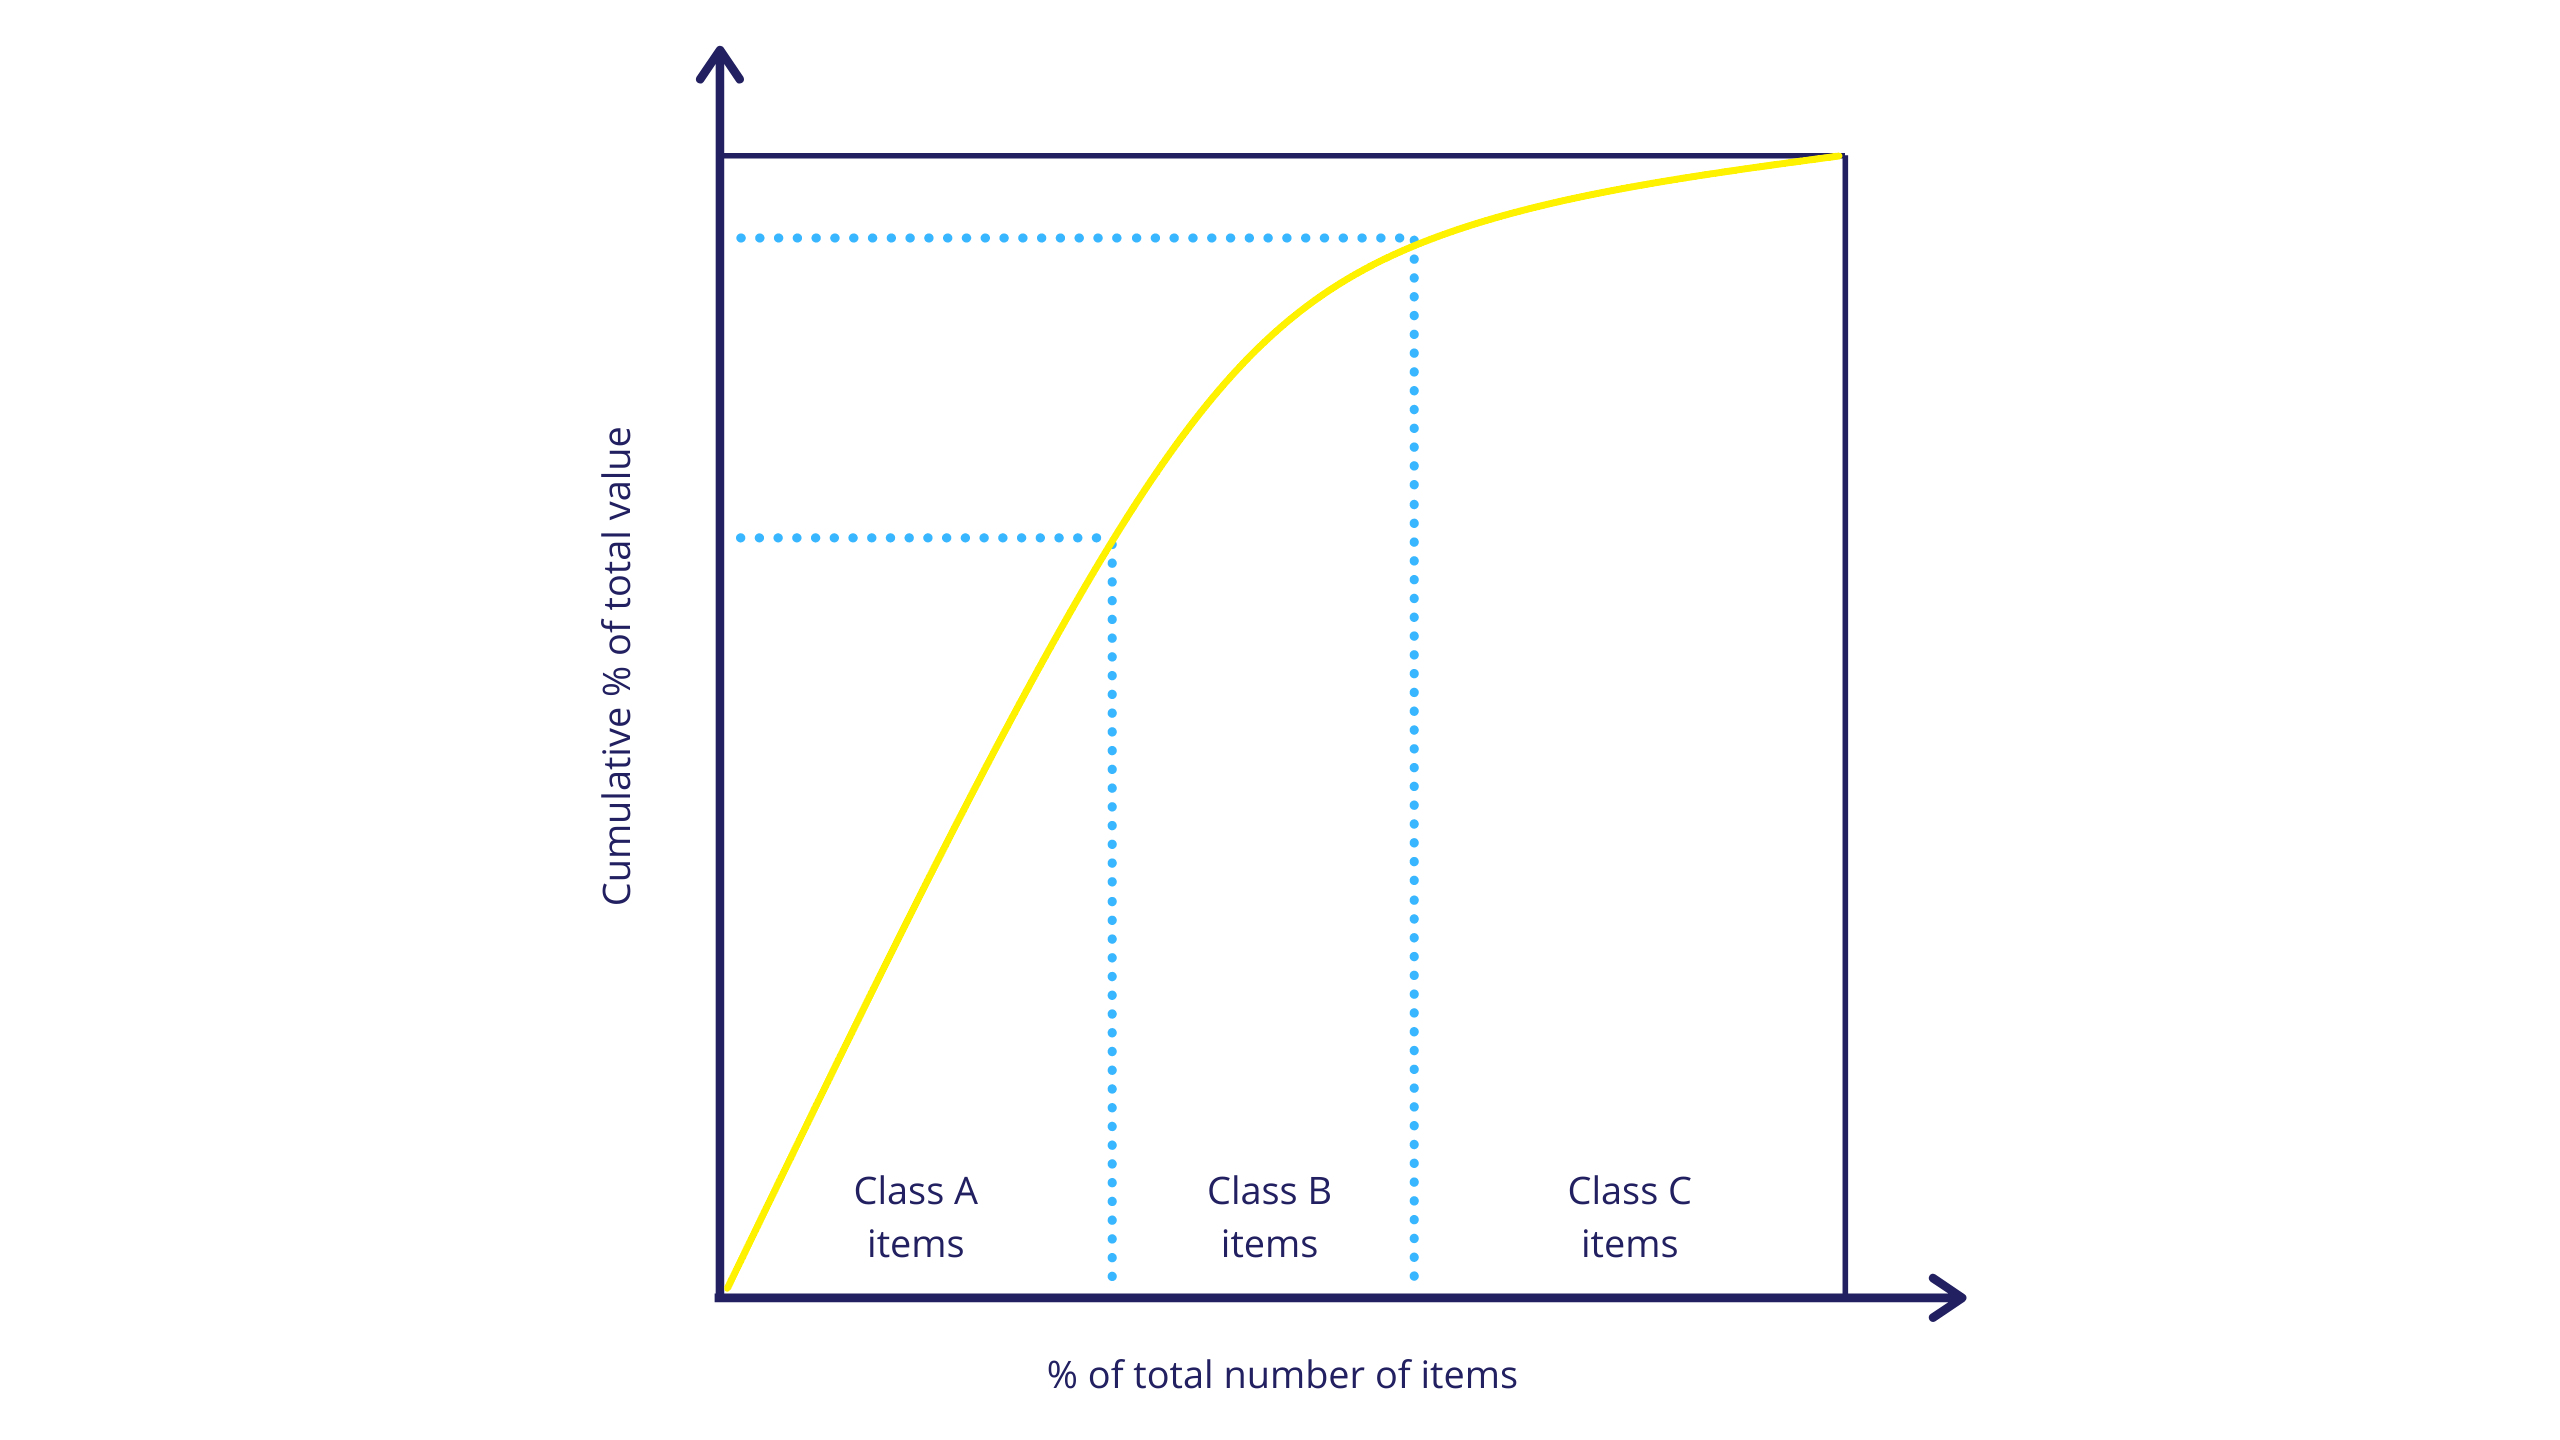
ABC analysis divides your SKUs into three categories:
- Category A represents a small percentage (around 20%) of the total number of SKUs but has the highest value (ca. 80% altogether).
- Category B represents a moderate amount of the total inventory with a moderate criterion value.
- Category C represents SKUs that constitute a large part of the total number of items (about 50%) but have a low criterion value (ca. 5% altogether).
It is strongly recommended to use consumption value or revenue generated by an SKU as the criterion, as quantity or volume is often not a great indicator of business value. Use an SKU’s consumption volume only when conducting ABC analysis for physically organizing your inventory.
An item’s consumption value can be calculated by taking the item’s cost per unit and multiplying it by its quantity used during a set period, preferably a year.
You can also easily find all your items’ yearly consumption values in your MRP software.
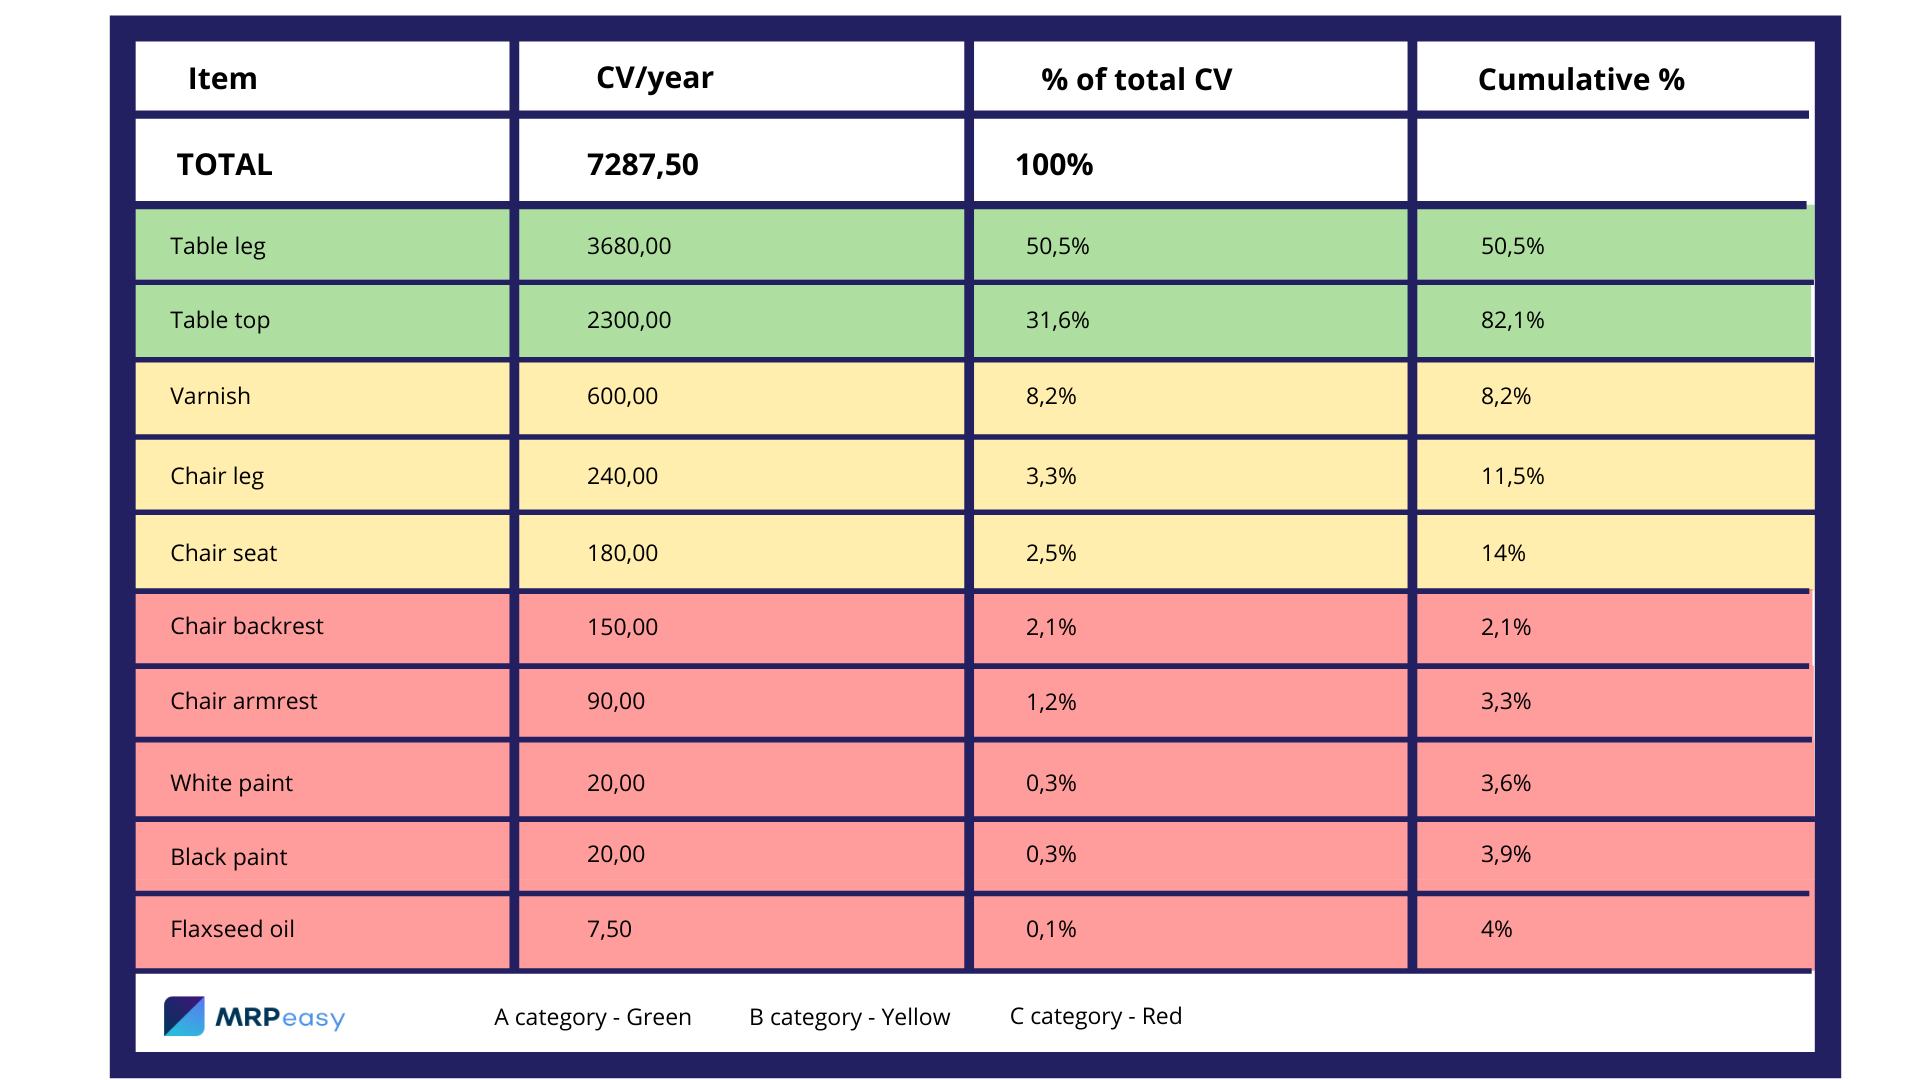
To not over-complicate the example, we are using a very small number of products and consumption for calculations.
You can, however, use ABC analysis for inventory management in a business of any scale.
Find the percentage by dividing the item’s yearly consumption value by the total yearly inventory consumption value and multiplying the result by 100.

Now add up the percentages starting from the largest.
When you reach the cumulative 80%, set a cap. The items making up the 80% belong to the A-category.
Then start again with the next items to get the 15% for the B-category, and then 5% for the C-category.
Approximations are absolutely fine if you cannot reach a perfectly round cumulative percentage.
How to use ABC analysis
Now, as your inventory is categorized by the value of the SKUs, it is time to put it into use.
Take a look at how you have managed your inventory so far. Do you keep the same amount of stock regardless of the article? Do you apply the same purchasing policies to all items? Do you spend an equal amount of time reviewing all SKUs?
If any of your answers to these questions was “yes”, you can put the analysis to good use right away.
Start by rethinking your purchasing and inventory policies according to the priorities set, giving more attention to A- and B-category SKUs, and less to C-items.
A-category items should get:
- Higher service levels and mathematically defined reorder points and safety stocks;
- More review time per item;
- More attention when negotiating prices and lead times with the suppliers;
- More resources allocated to them in general.
B-category items should receive less attention than A-class items, but should not be overlooked.
C-category items should receive the least amount of attention. In fact, C-items can most often be purchased in bulk or by using a just-in-time approach.
You can also assign separate key metrics and reporting practices to different class items to get better insight into their performance.
For example, A-items could be assigned a monthly review while C-products would be reviewed once every six months.
By doing all that, you could substantially cut down on inventory, reduce holding costs, prevent stock-outs and overstocking, develop a more reliable order processing time, and keep customers happy.
It is recommended to re-analyze your inventory at least once a year, as regular re-analysis can help you track changes in SKU performance and act accordingly by reassigning them to another category.
Limitations of ABC analysis
Although ABC analysis is seemingly very easy to conduct and provides plenty of benefits, it has its limitations.
- Spreadsheets could quickly become unreliable. Excel spreadsheets require manual updating and are prone to human error, making them less reliable for dynamic inventory classification, particularly in growing operations.
- Its stability depends on the stability of your items’ performance. Be prepared for a portion of your SKUs to be reclassified each time you review the analysis.
- To use it, you are going to need reliable historical cost and demand data by item. That means in case new items enter your inventory, you can reliably categorize them only after a while.
- It is static, which means it does not account for changing consumption patterns, e.g. seasonality. ABC analysis often categorizes inventory based on historical data. This static approach can lead to inaccuracies in a rapidly changing market, especially in e-commerce, where consumer preferences and demand patterns shift quickly.
- It does not account for essential items that are used infrequently. Especially in manufacturing, inventory items may have interdependencies that are crucial for building final products. ABC analysis might leave SKUs that are rarely consumed yet are still essential to your business without the necessary attention.
- Managing large inventories can be very complicated. In businesses with extensive and diverse inventory, the simplicity of ABC analysis can be a drawback. The process can become cumbersome and less effective when dealing with a vast array of products.
In conclusion, while ABC analysis is a useful framework for inventory management, its effectiveness can be limited by several factors that businesses need to account for.
XYZ analysis
One of the greatest weaknesses of ABC analysis is that it employs only one parameter – mostly consumption value – and does not account for fluctuations in consumption.
For example, if you have items that are consumed in huge quantities at a time but very irregularly, then by using the ABC method, you could classify them as A-class articles. However, due to them being used periodically, having a large amount of them in inventory at all times would be unfeasible.
More so, it would be detrimental to business due to elevated holding costs, and possible damaging or perishing of the goods.
On the other hand, having an item with low but constant demand would be classified as a C-article. Stable demand, however, requires constant attention. That means we are going to need to account for the various levels of uncertainty in consumption. This is where XYZ analysis comes into the equation.
XYZ analysis is a great addition to your ABC analysis if the demand for some of your items fluctuates.
While ABC analysis classifies items by value, XYZ analysis categorizes them by uncertainty of demand.
Using ABC analysis together with XYZ gives you a much better overview of which articles in your inventory should get more attention. It helps avoid shortages and overstocking by providing the basis to accurately determine stock and safety stock levels in case the demand for your SKUs is not always stable.
How to conduct an XYZ analysis
Similarly to the ABC analysis, the XYZ approach divides your stock into three categories:
- X marks items with stable consumption.
- Y marks items with some fluctuation in consumption.
- Z marks items with heavy fluctuation in consumption.
You can categorize your inventory with the XYZ analysis by looking at your items’ historical data and seeing by what margin their weekly or monthly consumption fluctuates.
You can also get a simple visual overview of each item’s fluctuations in stock from your MRP system at Stock -> Items -> Item Reports.
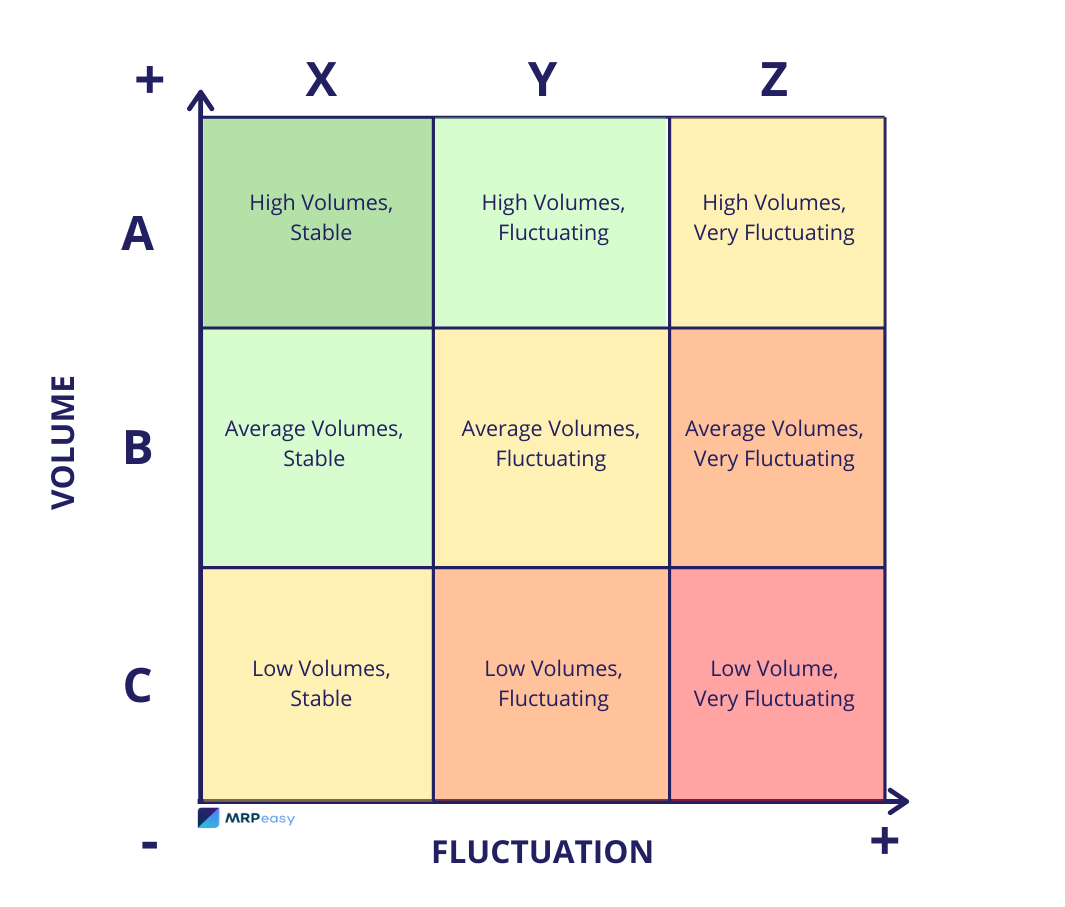
Assigning your items both into the ABC and XYZ categories will give you a classification matrix with 9 categories:
- AX items have high consumption value and stable demand
- AY items have high consumption value and fluctuating demand
- AZ items have high consumption value and greatly fluctuating demand
- BX items have average consumption value and stable demand
- BY items have average consumption value and fluctuating demand
- BZ items have average consumption value and greatly fluctuating demand
- CX items have low volumes and stable demand
- CY items have low volumes and fluctuating demand
- CZ items have low volumes and greatly fluctuating demand
How to use XYZ analysis
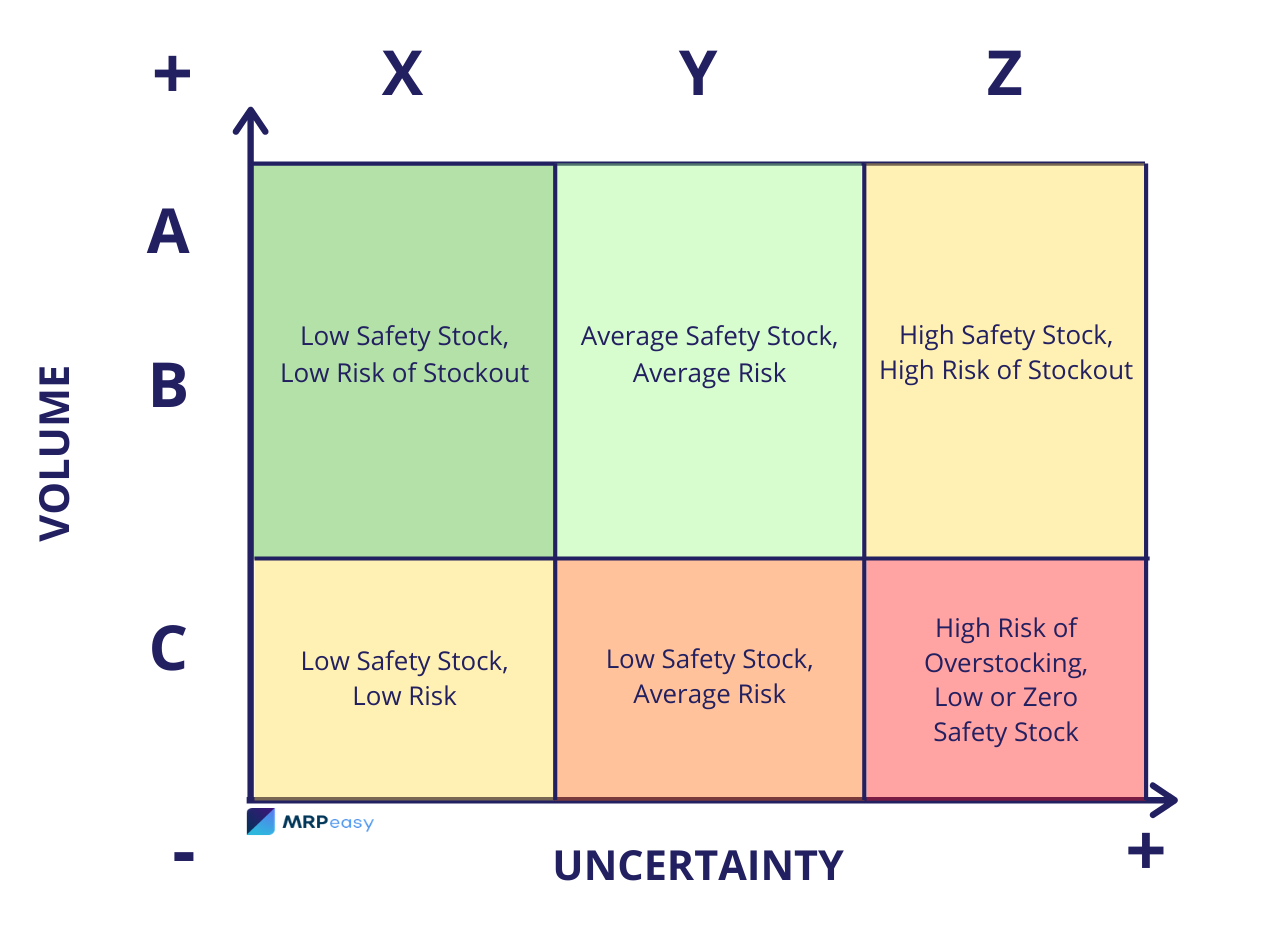
You can use the ABC XYZ analysis to better determine the items’ safety stock.
- AX or BX items are stable, so, counter-intuitively, they do not need a lot of buffer for a high service level.
- AY or BY items have noticeable fluctuations so they require more inventory coverage.
- AZ or BZ items have very uncertain demand so they would need a larger amount of safety stock for a high service level. So, it may be reasonable to define a lower service level for these to free up cash and reduce standing inventory.
For C-class items with low consumption value, you do not need a lot of safety stock by definition.
- Large fluctuations of CX items rarely occur, so they have a very low risk of stock-outs or overstocking.
- CY items would require more safety stock due to fluctuations in demand to prevent stock-outs, but that may not be so important to your core business.
- CZ products can make up a large portion of your inventory and have a high risk of overstocking. For those items, you could have a minimum amount of safety stock available, or none at all.
Using ERP software for inventory optimization
Utilizing an inventory management system such as manufacturing ERP software can significantly aid in conducting ABC analysis and optimizing inventory.
ERP systems consolidate and analyze vast amounts of data related to sales, procurement, production, and inventory levels, which is crucial for categorizing items into A, B, and C groups based on their value and turnover. By providing detailed insights into inventory usage patterns, costs, and demand trends, an ERP system helps in identifying high-value items (Category A) that require close monitoring and frequent replenishment, moderate-value items (Category B) needing less frequent attention, and low-value but essential items (Category C) that might benefit from bulk purchasing or just-in-time ordering.
In terms of overall inventory optimization, an ERP system offers real-time tracking and automated reporting features, enabling more accurate forecasting and demand planning. This results in better stock level management, reduced overstock or stockouts, and improved cash flow. The integration capabilities of ERP software also mean that information from various departments is centralized, allowing for a more coordinated approach to inventory management, where purchasing, production, and sales data are aligned to ensure inventory efficiency across the entire supply chain. This holistic view provided by an ERP system is essential for effective inventory optimization, ensuring that resources are allocated effectively and inventory investment is aligned with business goals.

Key takeaways
- ABC analysis is a practical inventory control technique that enhances supply chain insight, reduces sitting inventory, and improves inventory efficiency.
- It categorizes stock-keeping units based on importance or consumption value, applying the Pareto principle to identify a small percentage of items constituting the majority of inventory value.
- This analysis aids in setting management priorities, with high-value A-items requiring more attention and control, thereby optimizing resource allocation and inventory management.
- ABC analysis influences stocktake frequency and guides the physical arrangement of stockrooms, ensuring high-demand items are easily accessible, thereby streamlining operations and minimizing errors.
- The technique has broad applications in manufacturing and inventory management, leading to improved inventory accuracy, reduced stockouts and excess inventory, and lower inventory costs.
- While effective, ABC analysis has limitations, including reliance on static historical data, which may not accurately reflect changing market dynamics or inter-item dependencies, especially in large, diverse inventories.
- Supplementing ABC analysis with XYZ analysis, which categorizes items by demand uncertainty, provides a more comprehensive approach, helping to avoid shortages and overstocking, and optimize safety stock levels.
Frequently asked questions
In a retail store, ABC analysis might categorize high-cost electronics like laptops as ‘A’ items, moderately priced appliances like blenders as ‘B’ items, and low-cost accessories like phone cases as ‘C’ items, based on their value and sales volume.
Analyzing ABC analysis involves categorizing inventory items based on criteria such as sales volume, consumption value, or frequency of use, and then using this categorization to prioritize inventory management efforts and resources.
ABC market analysis is a strategic approach where a market or customer base is segmented into three categories – A, B, and C – based on factors like revenue generation or purchasing behavior, to prioritize marketing and sales efforts towards the most profitable segments.
XYZ analysis is an inventory categorization technique that classifies items based on the variability of their demand. ‘X’ items have stable and predictable demand, ‘Y’ items have moderately fluctuating demand, and ‘Z’ items experience high levels of demand variability. This analysis helps in optimizing inventory management by aligning stocking strategies with the predictability of demand.
You may also like: 11 Most Important Inventory Management KPIs